Platform
The OmiCairn platform
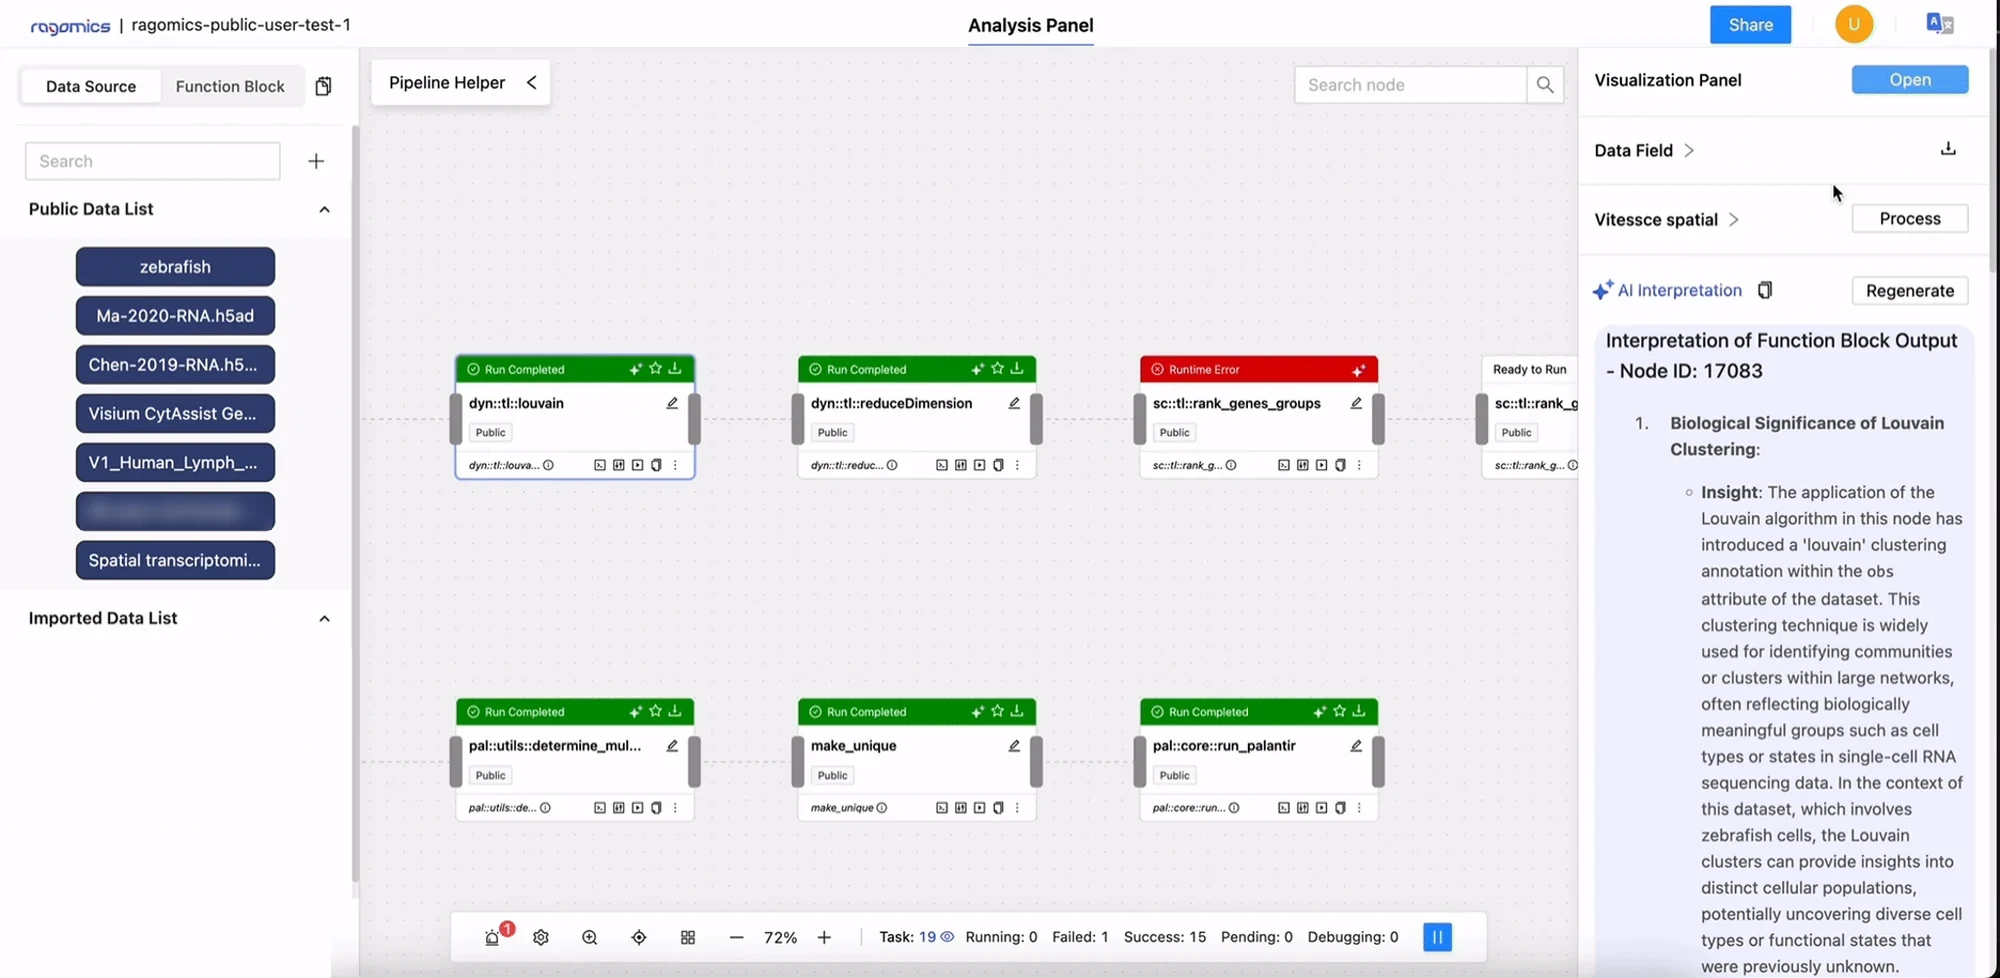
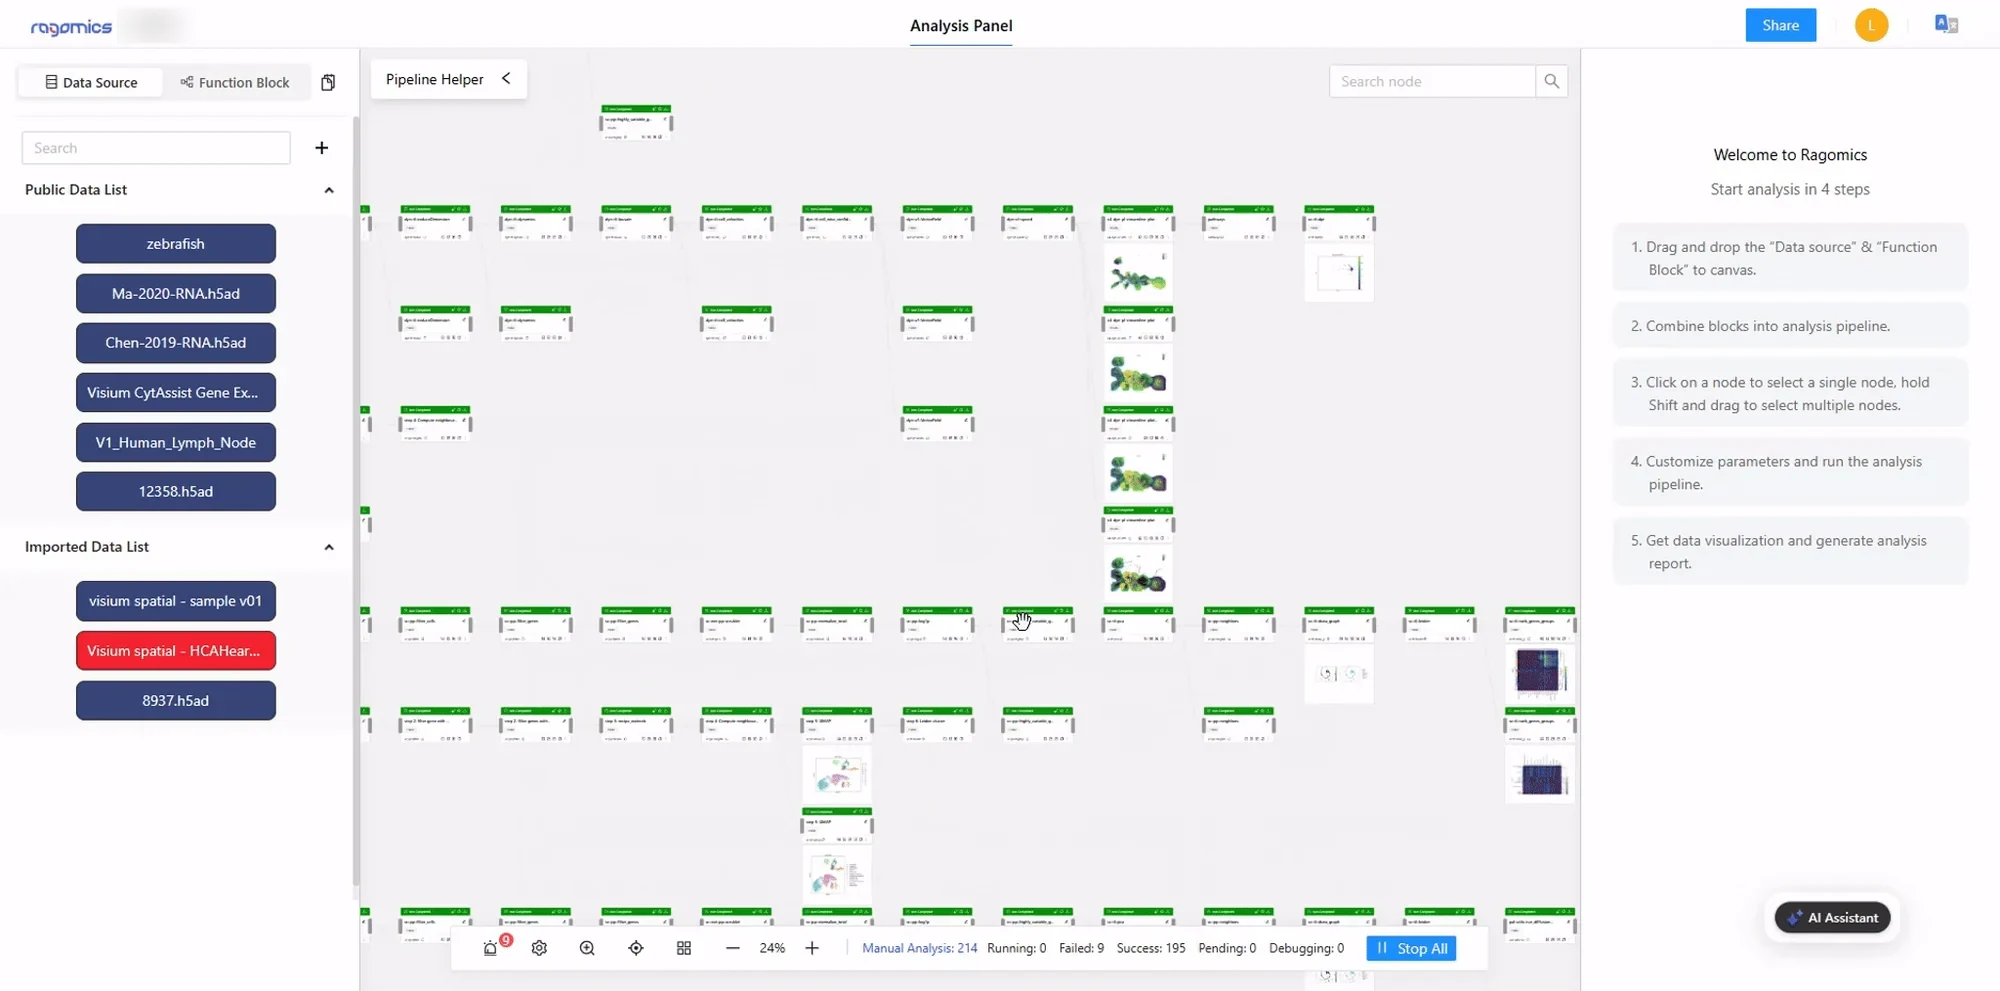
OmiCairn’s first version, released under its previous name RAGOmics, was an interactive web platform for omics analysis. It is now fully deprecated and retired. Users dragged datasets and function blocks onto a canvas, joined them into an analysis tree, ran every node in its own container, and inspected the results in a visualization panel with an AI assistant at hand. The analysis tree of function blocks is still its core. What later versions added is accountability: pre-registered plans, deterministic cross-checks, a claim-review agent and reviewer agents.
Lineage
Four stages, one unit of work
Each stage kept the analysis tree of containerized function blocks and changed who drives it: a person at a canvas, then agents on one machine, then agents on a hosted platform, then a pipeline that has to justify every claim it makes.
-
First versionRetired
OmiCairn v1 (as RAGOmics)
An interactive web platform for omics analysis. Users built analysis trees of function blocks on a canvas, ran each node in its own container, explored results in a visualization panel and asked an AI assistant for help.
- Analysis tree of function blocks
- Visualization panel for single-cell and spatial data
- Assistant for parameters, errors and interpretation
-
Research prototype
OmiCairn-early
A local agent. Language-model agents turn a request in plain English into an analysis tree, write each function block, run it in a Docker container, debug it over several turns and review its output.
- Orchestrator plans the tree
- Multi-turn bug fixing in the container
- Job review with automatic rework
-
Engineered web platform
OmiCairn-engineering
The multi-user web platform: an analysis-graph editor, data management, a visual panel and an AI assistant, with a backend, a computation worker that dispatches containerized jobs, and a runner for autonomous per-node agents.
- Web interface, backend and worker
- Jobs on local Docker or cloud batch
- LLM bug fixer and workflow generation
-
Accountable research pipelineUsed for the campaign
OmiCairn
A question goes in, not a pipeline. Agents scope the question, pre-register the analysis plan and decision rules, execute it, cross-check every reported number against the code that produced it, and review whether the evidence answers the question.
- Pre-registration and deterministic cross-check
- Claim-review agent and reviewer agents
- Experience replay across runs; experts can steer
The unit that carried over
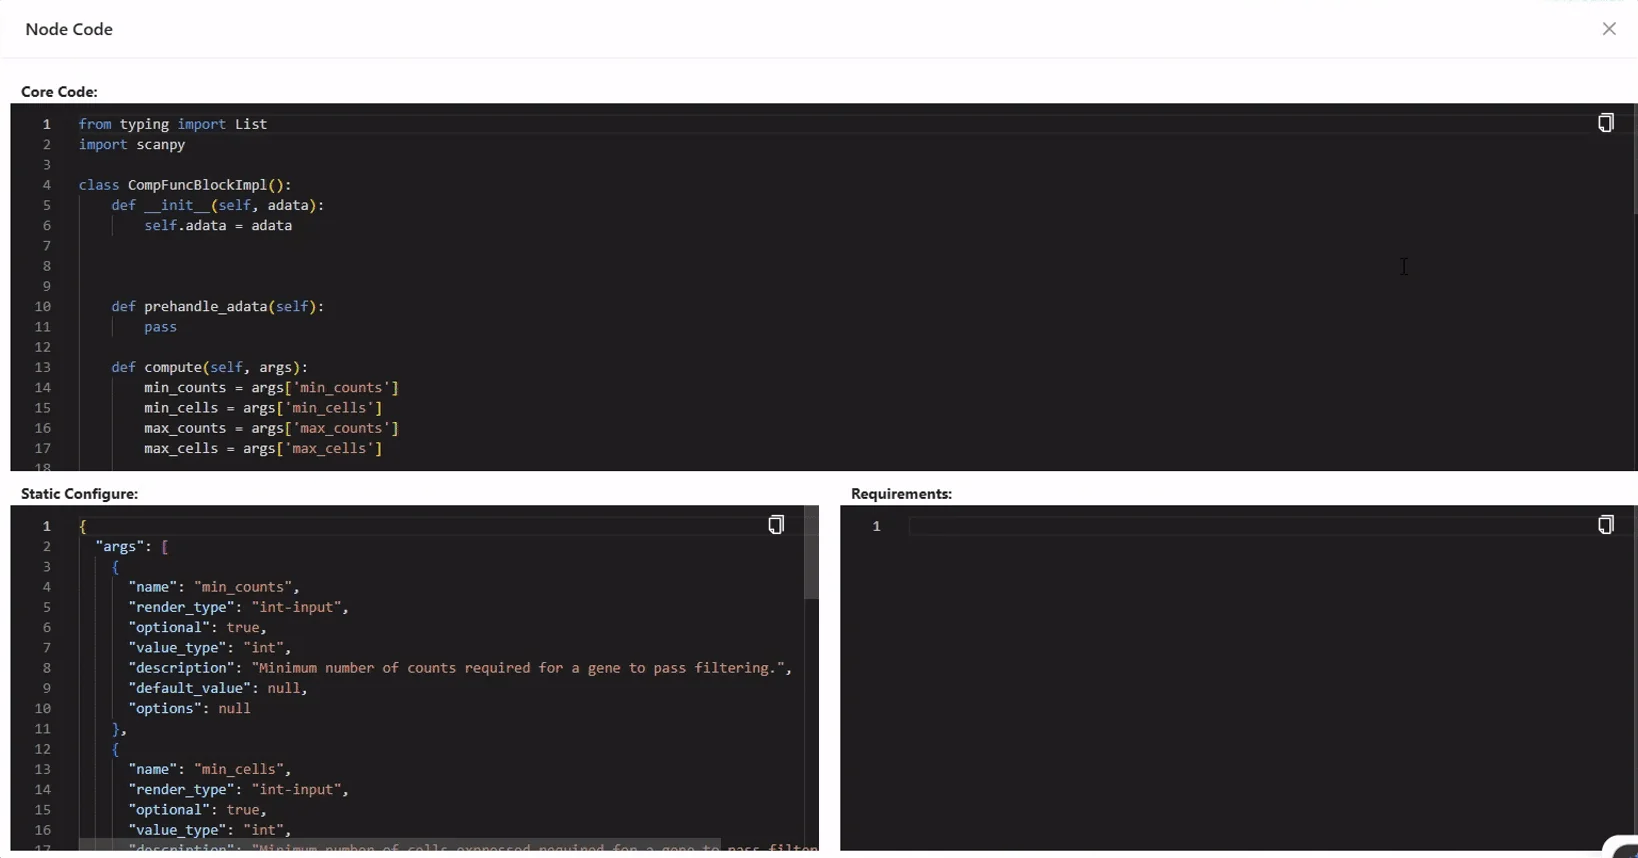
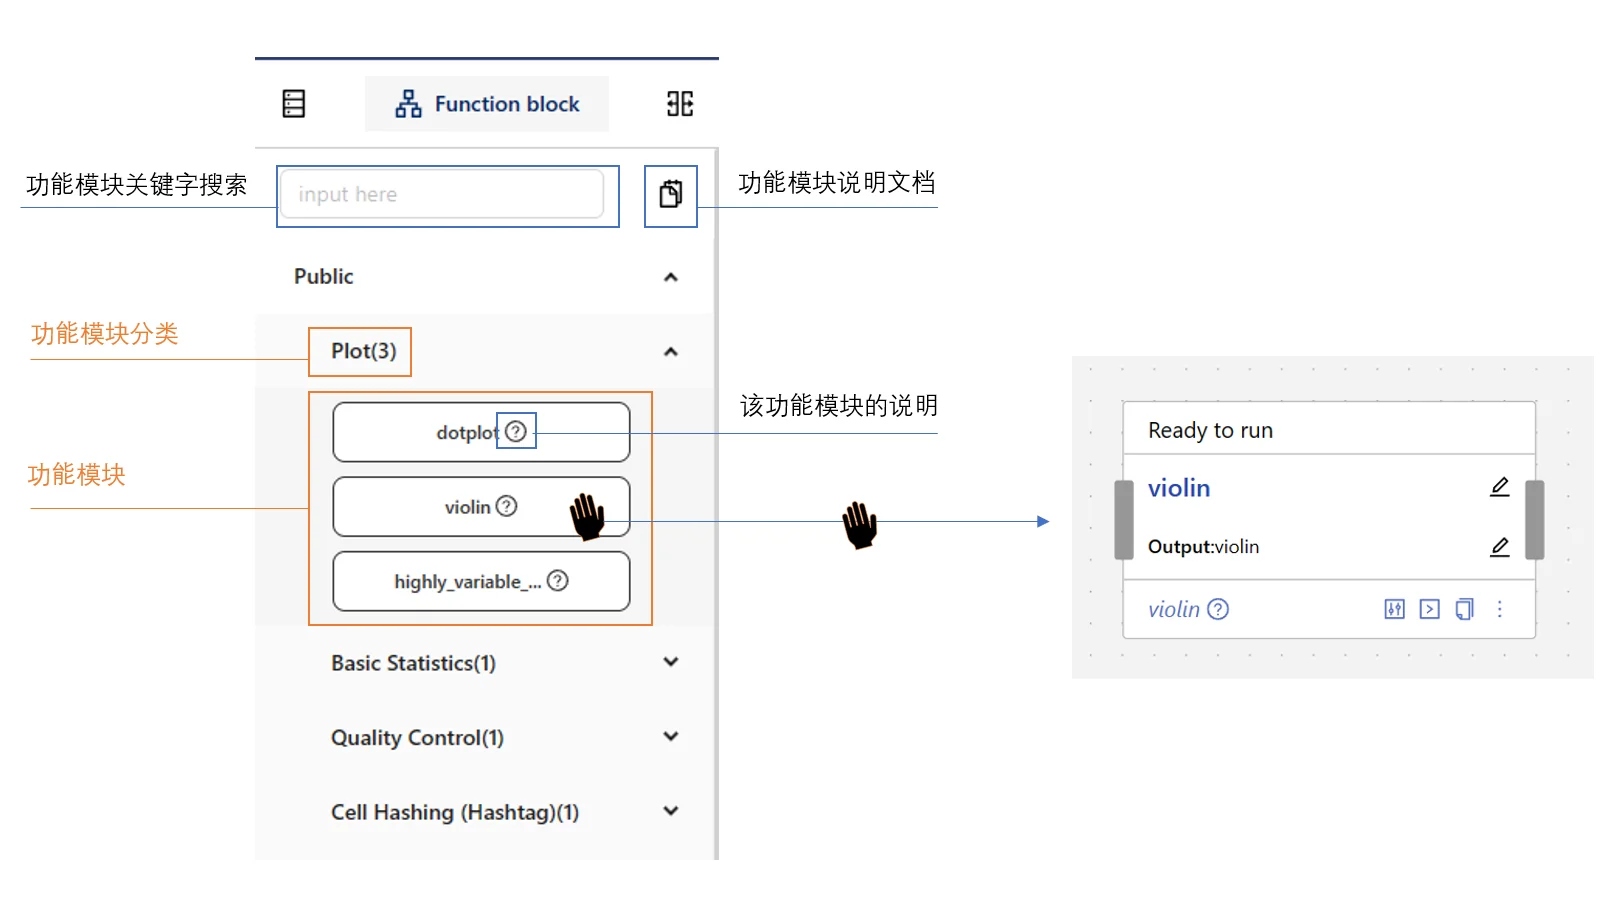
- Function blockCode (Python, R or shell), its dependencies and container image, typed arguments, documentation
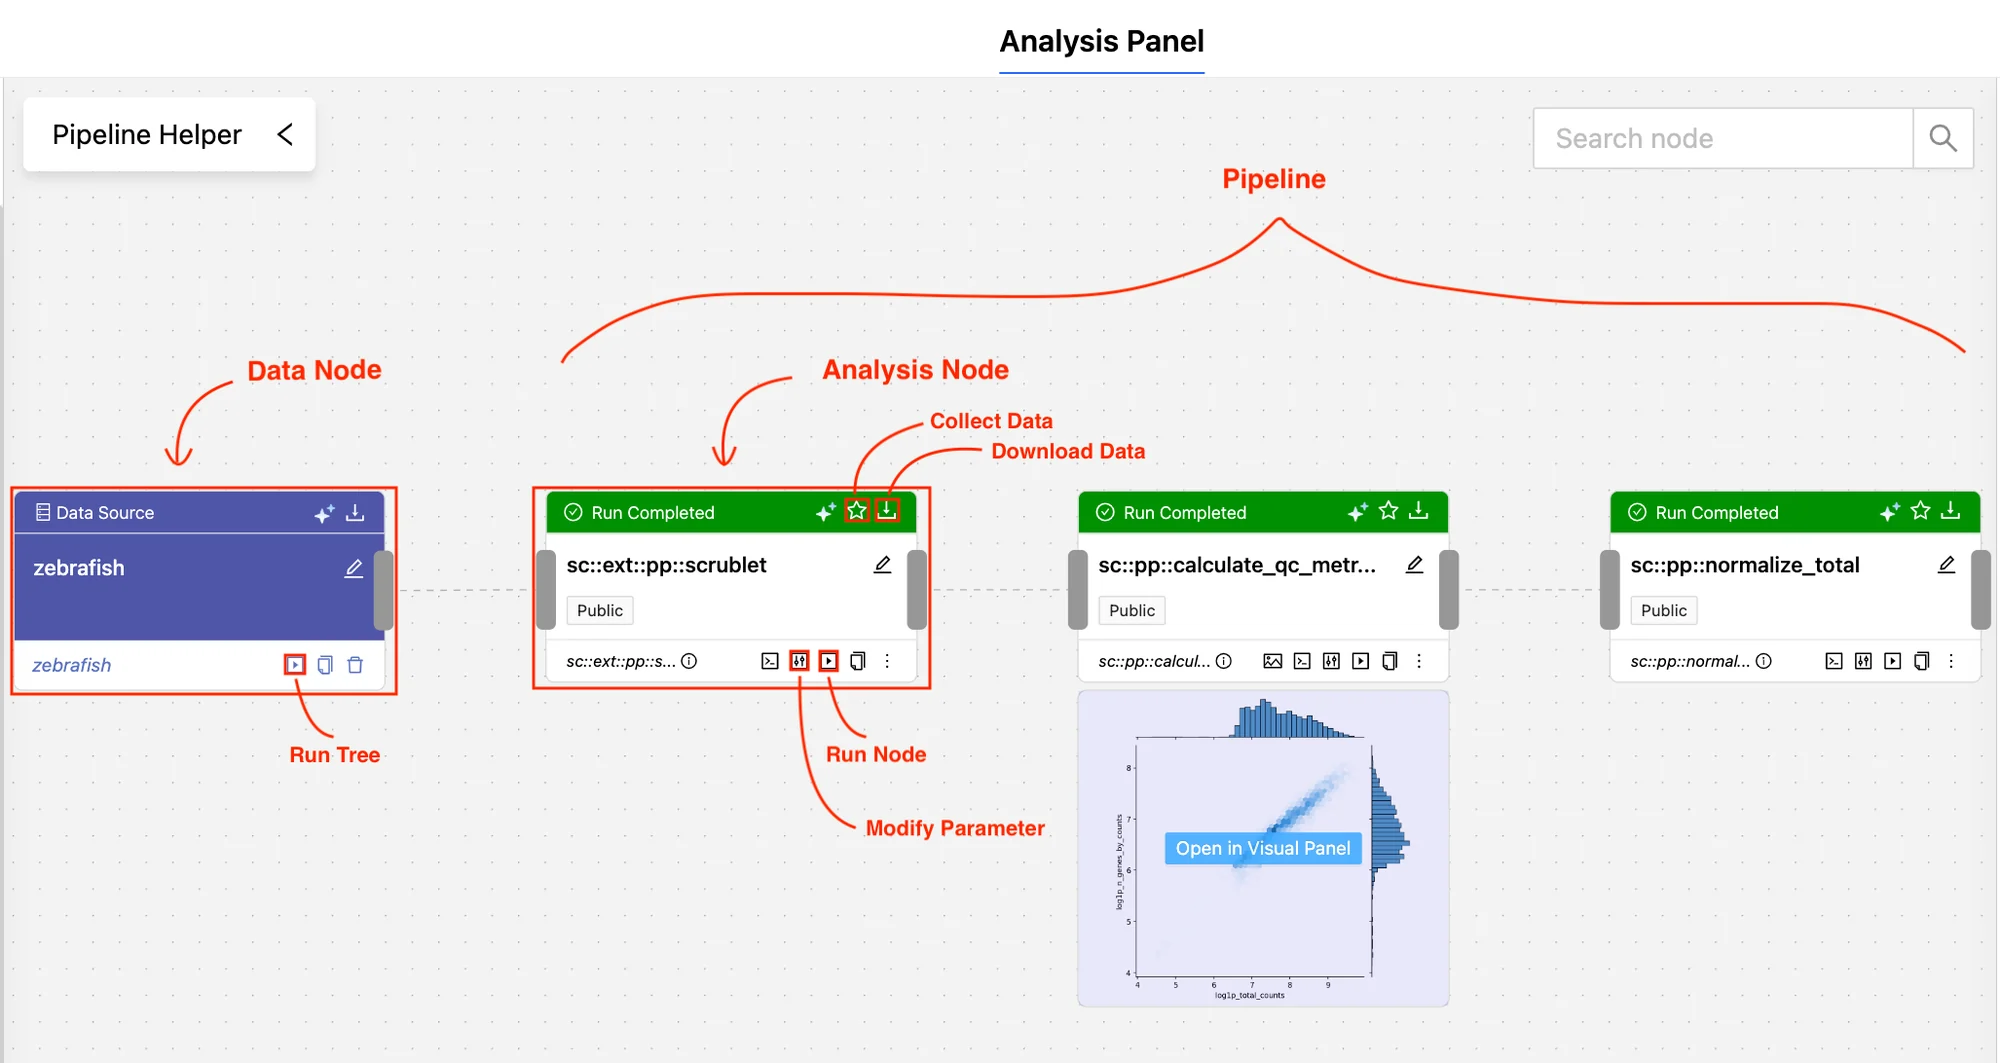
- NodeThe block with parameters and configuration, run in its own container, with results and logs
- Analysis treeNodes joined by data dependencies; each node can be inspected, rerun or extended
First version
- Analysis trees of function blocks, each block instantiated as a node.
- Containerized execution, with code, parameters, logs and outputs kept per node.
- Interactive visualization of results in a visual panel.
- A person drives: builds the tree, sets parameters, decides what runs next.
- Assisted debugging of failed nodes.
Today
- A question as input; agents scope it and plan the tree.
- Pre-registration of hypotheses and decision rules before any analysis runs.
- Deterministic cross-check: every reported number resolves to executed outputs.
- A claim-review agent and reviewer agents check the report against the evidence.
- Experience replay of validated blocks and fixes; experts can still steer.
Gallery
The first version, screen by screen
Seventeen screenshots and three short clips from the first version’s user guide, grouped by task.
RAGOmics is completely retired. Its source code is released in OmiCairn-engineering.
The first version shown in this gallery is fully deprecated. Its human-engineered web platform has been replaced by our latest OmiCairn-based web platform, and its source code is public for transparency.
Source code: OmiCairn-engineering ↗The interface is bilingual, so some screens are in Chinese. Select a screenshot to enlarge it; clips play muted while in view, unless reduced motion is on.
Build the analysis tree
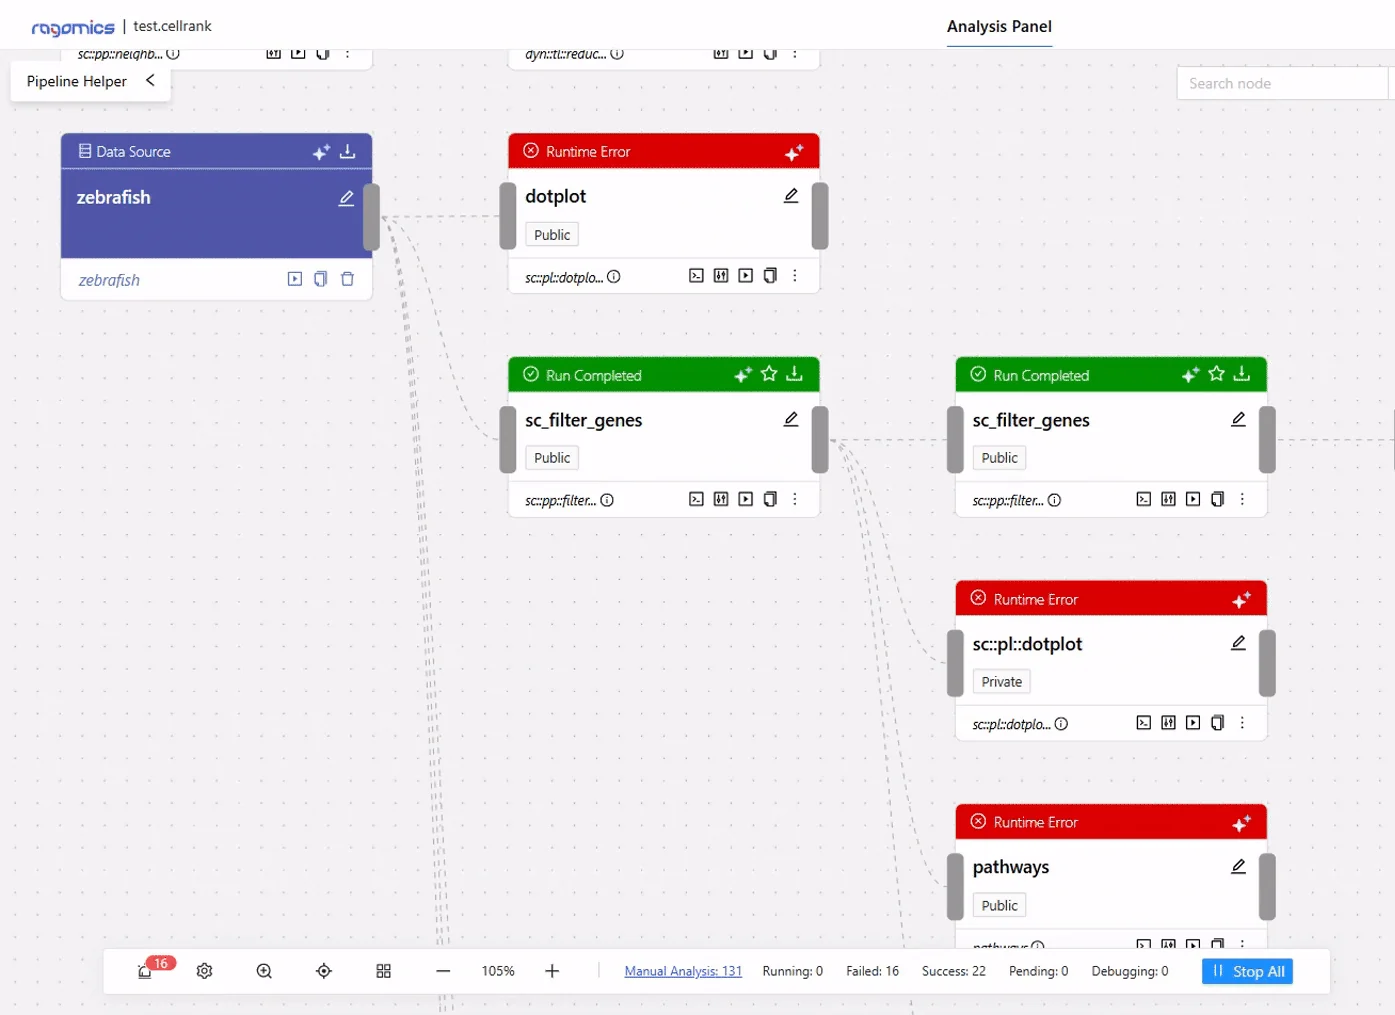
Datasets and function blocks are dragged onto a canvas and wired together. Each connected block becomes a node that runs on its own, and the whole graph is the analysis tree.

Inspect results visually
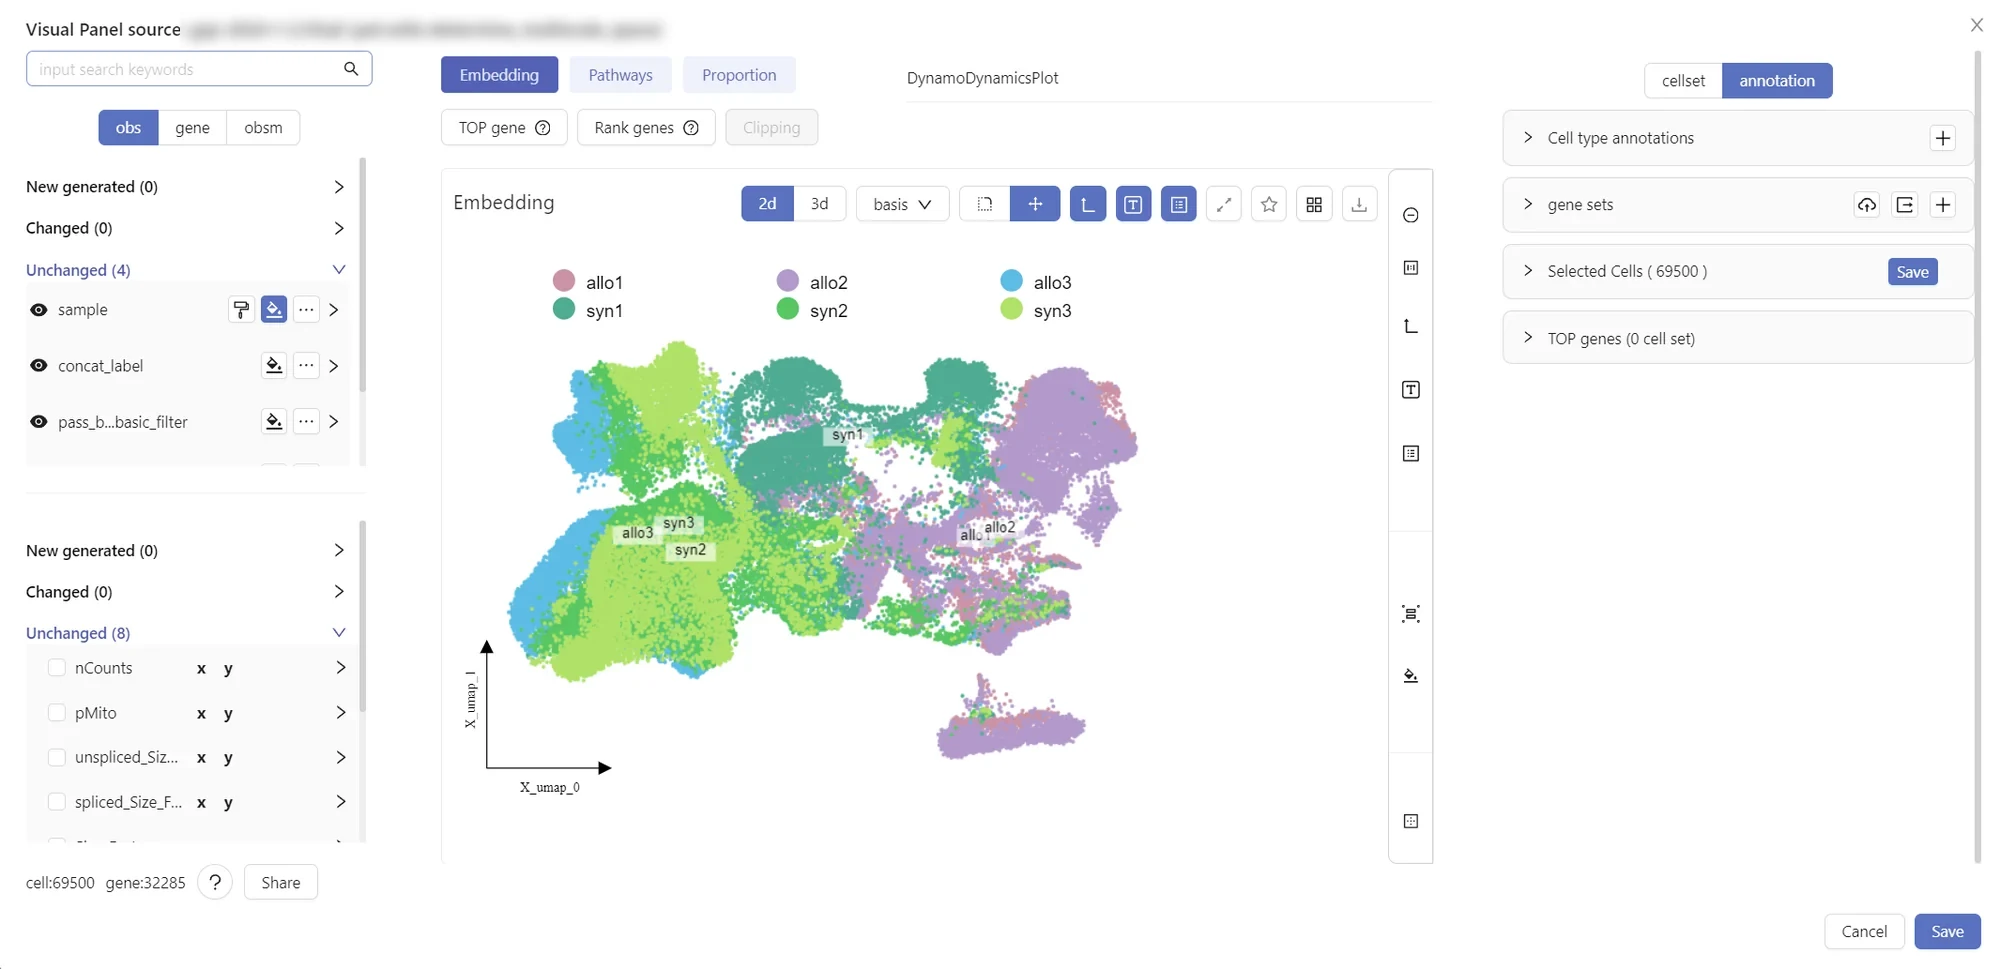
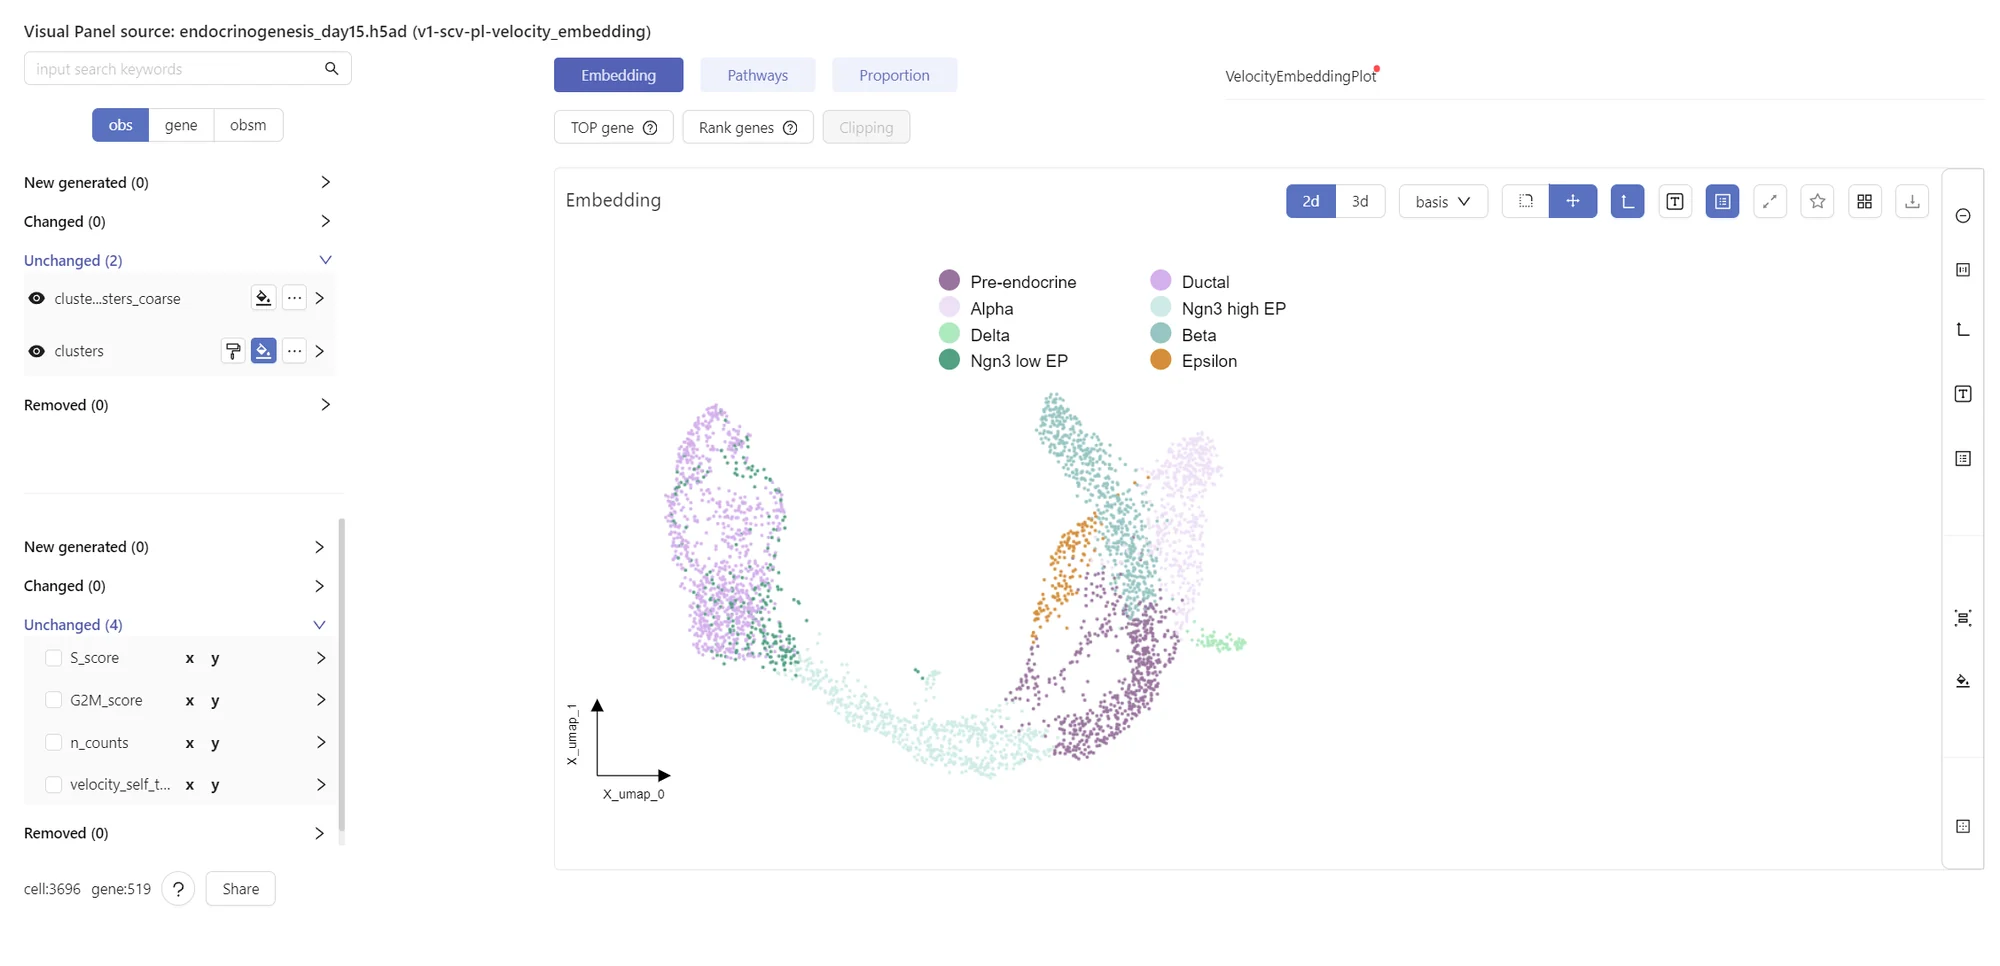
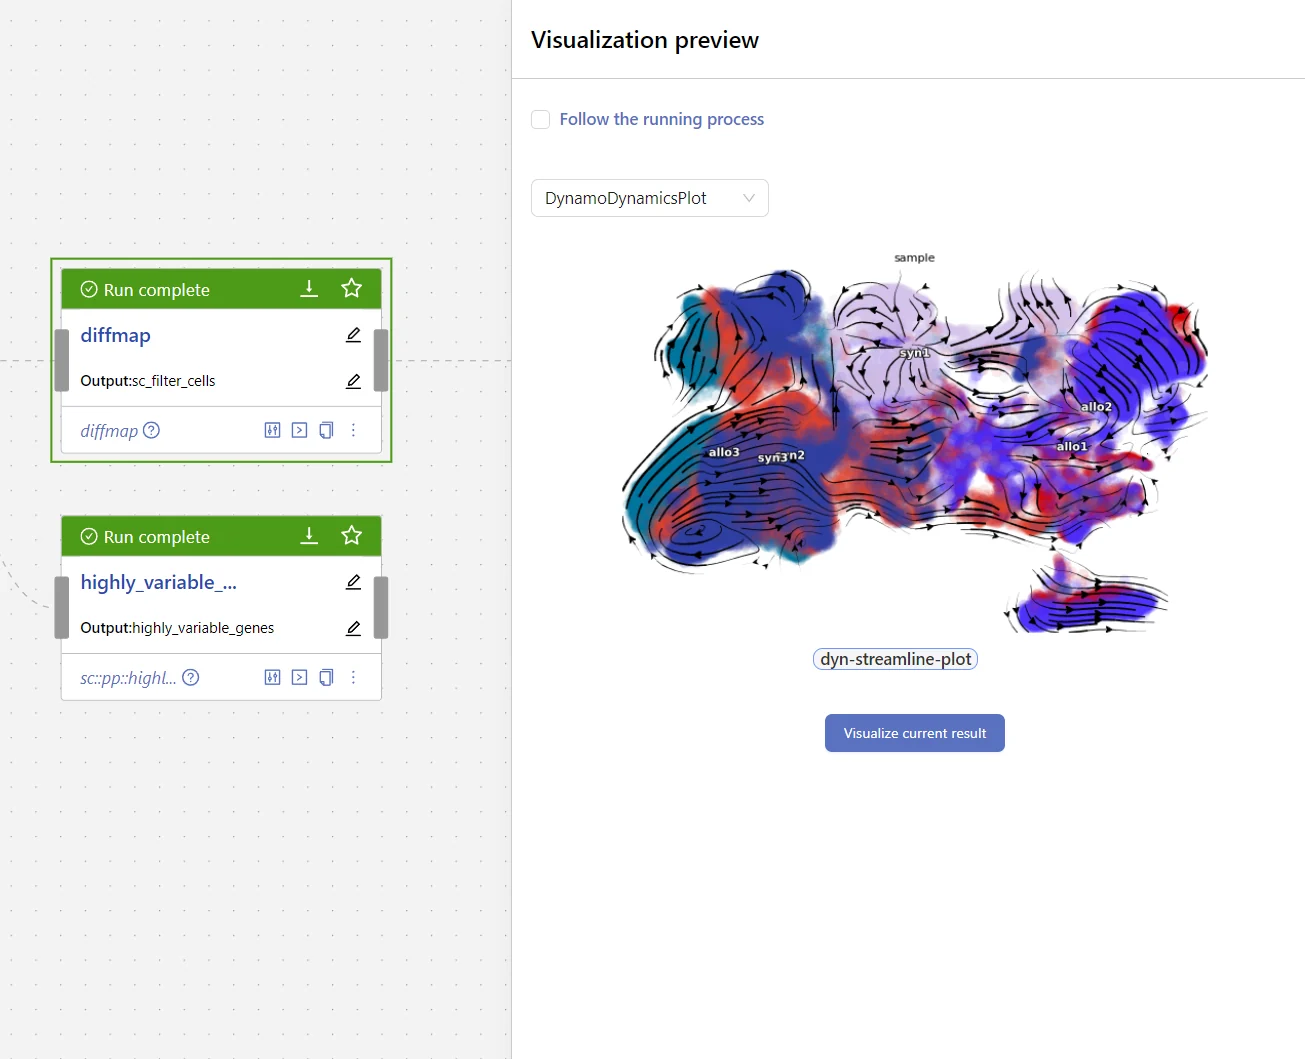
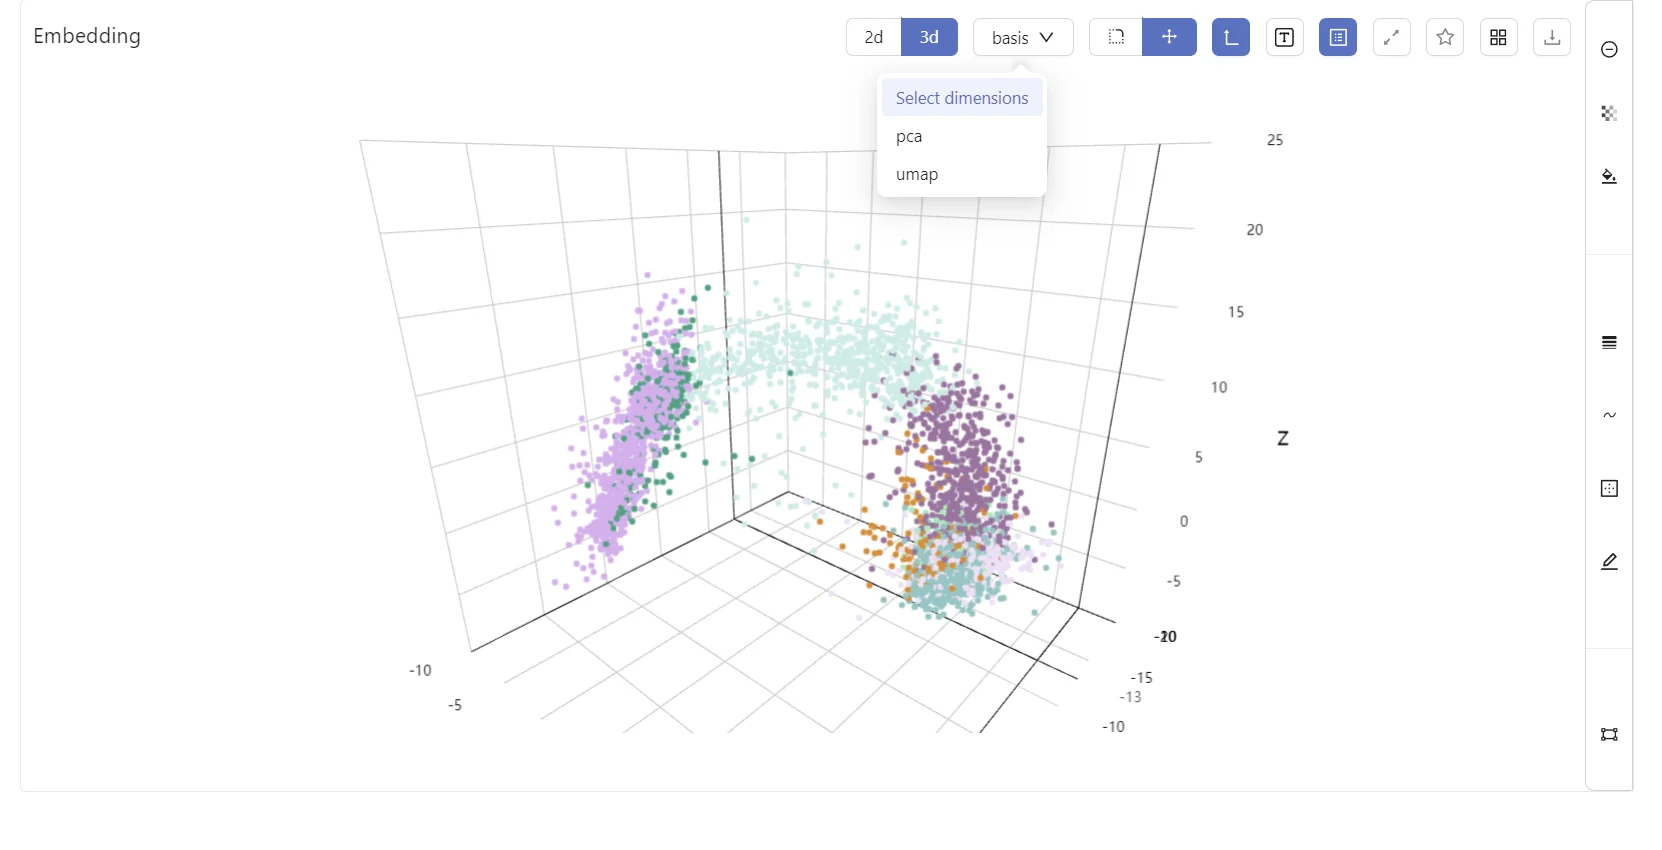
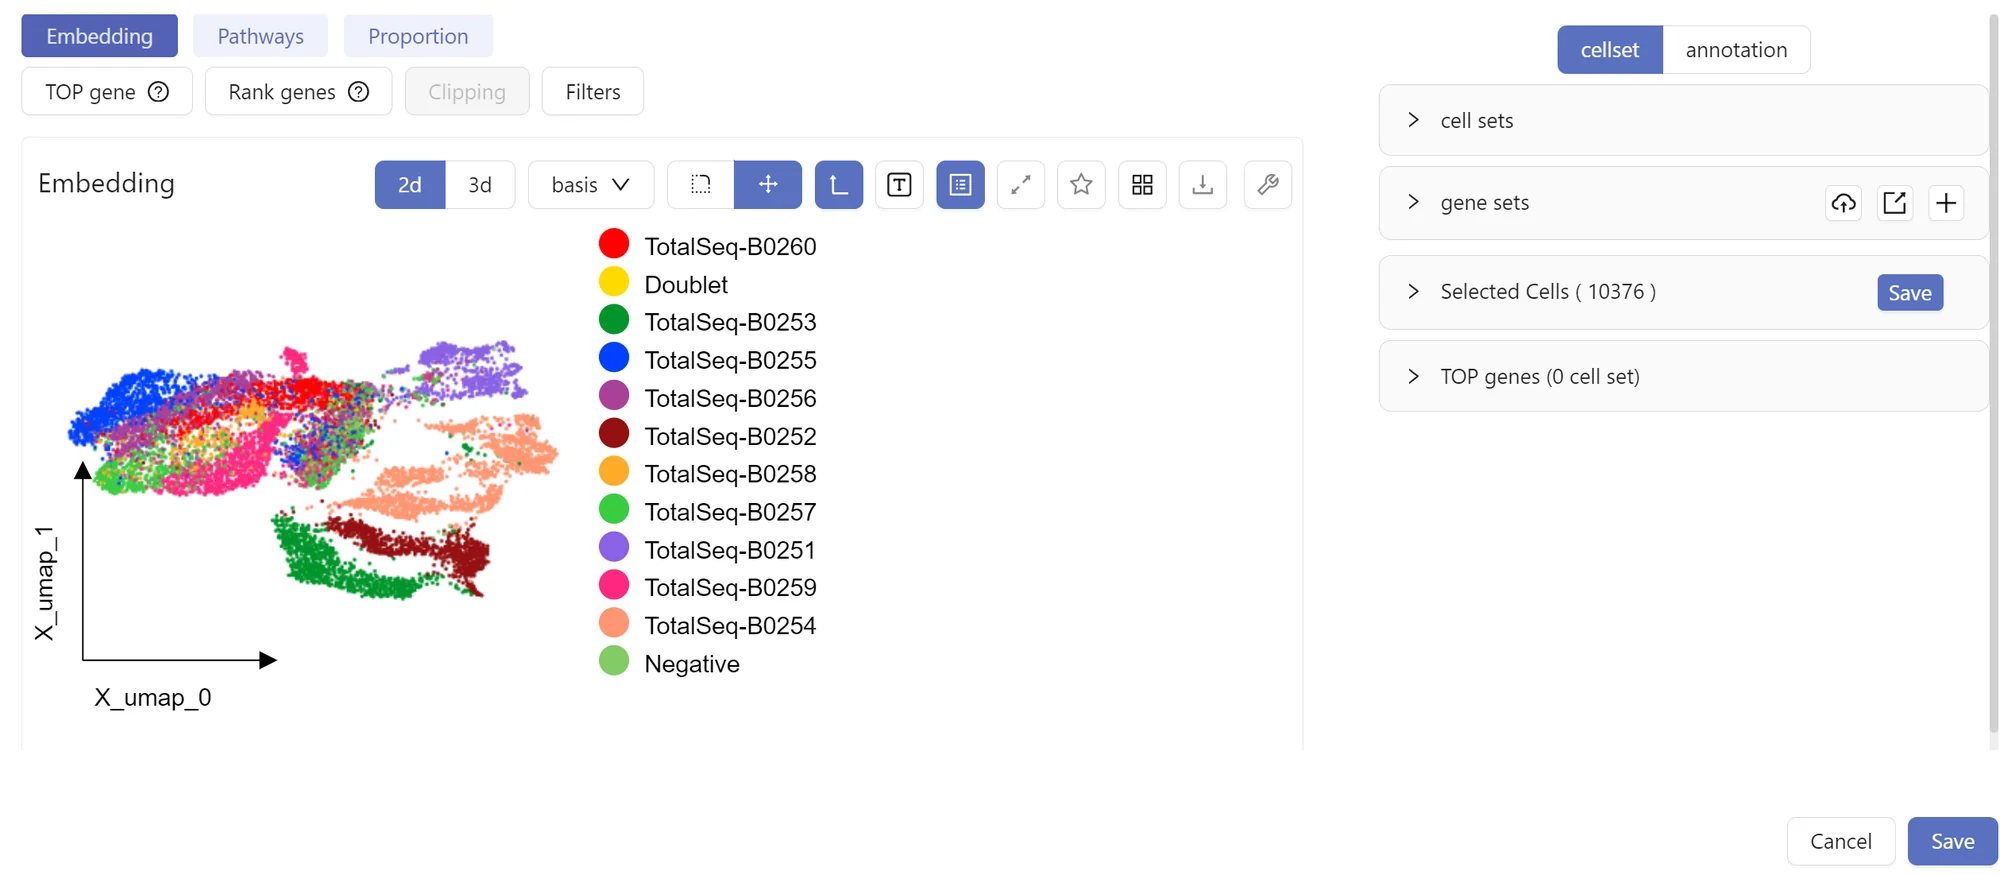
Any completed node opens in a visualization panel built for single-cell and spatial data: embeddings, cell metadata, gene lists, cell sets and annotations.
Work with the assistant
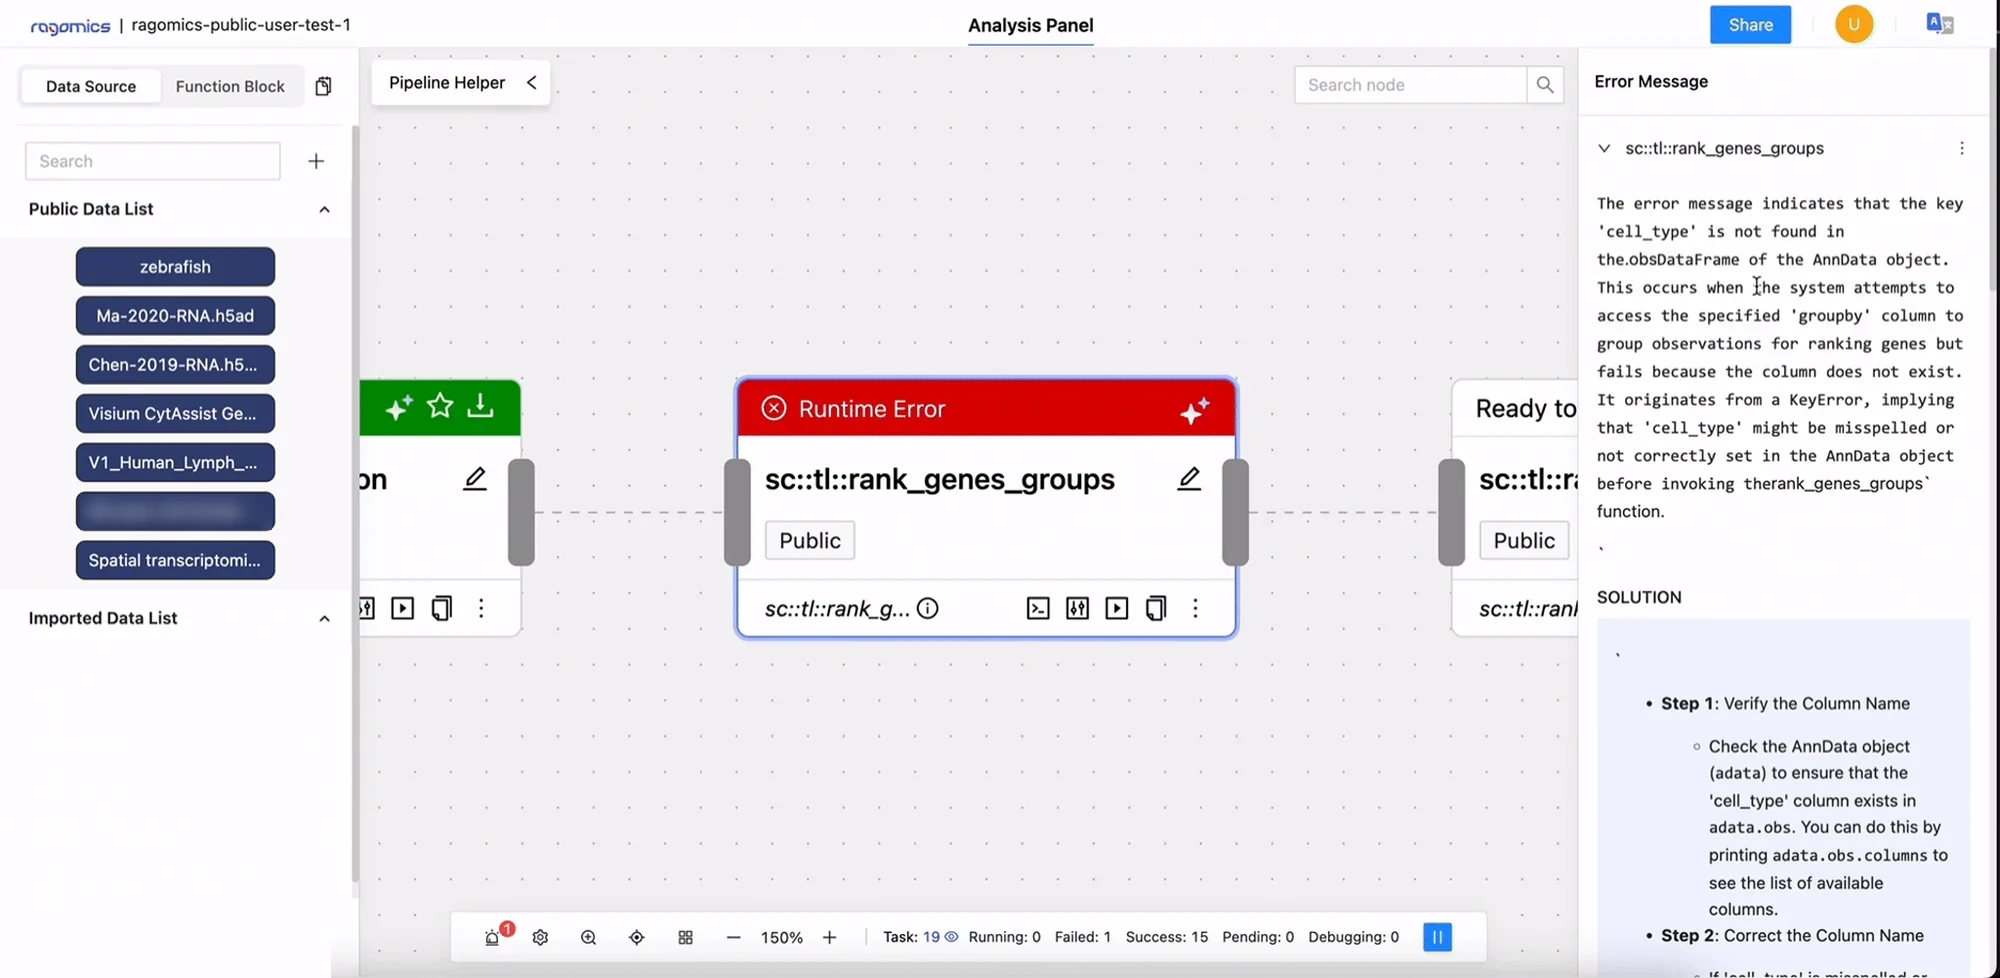
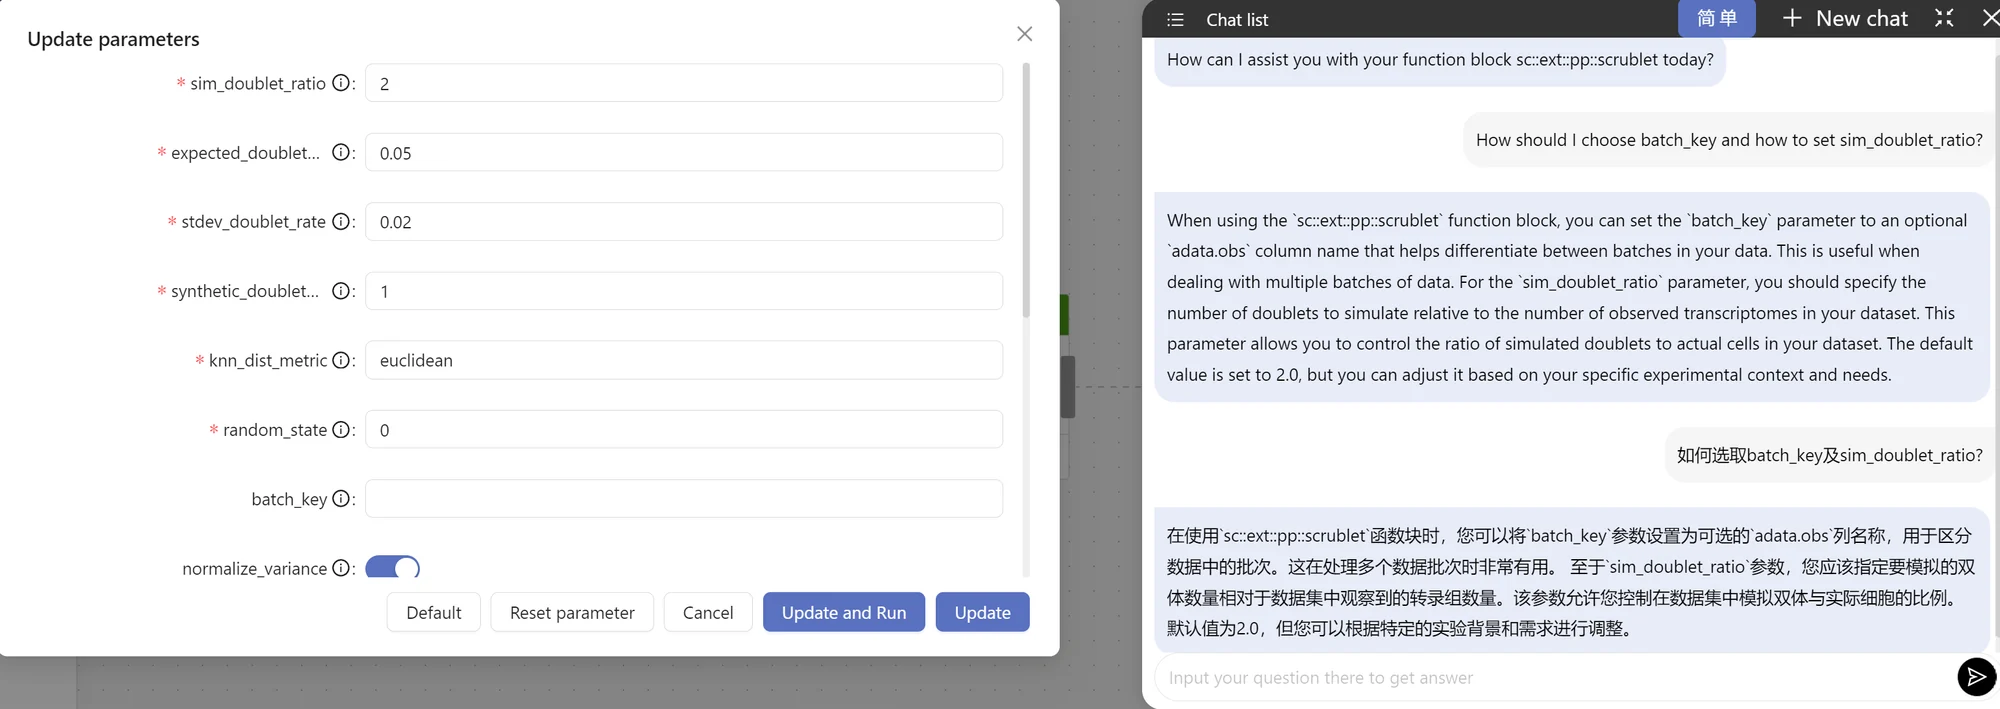
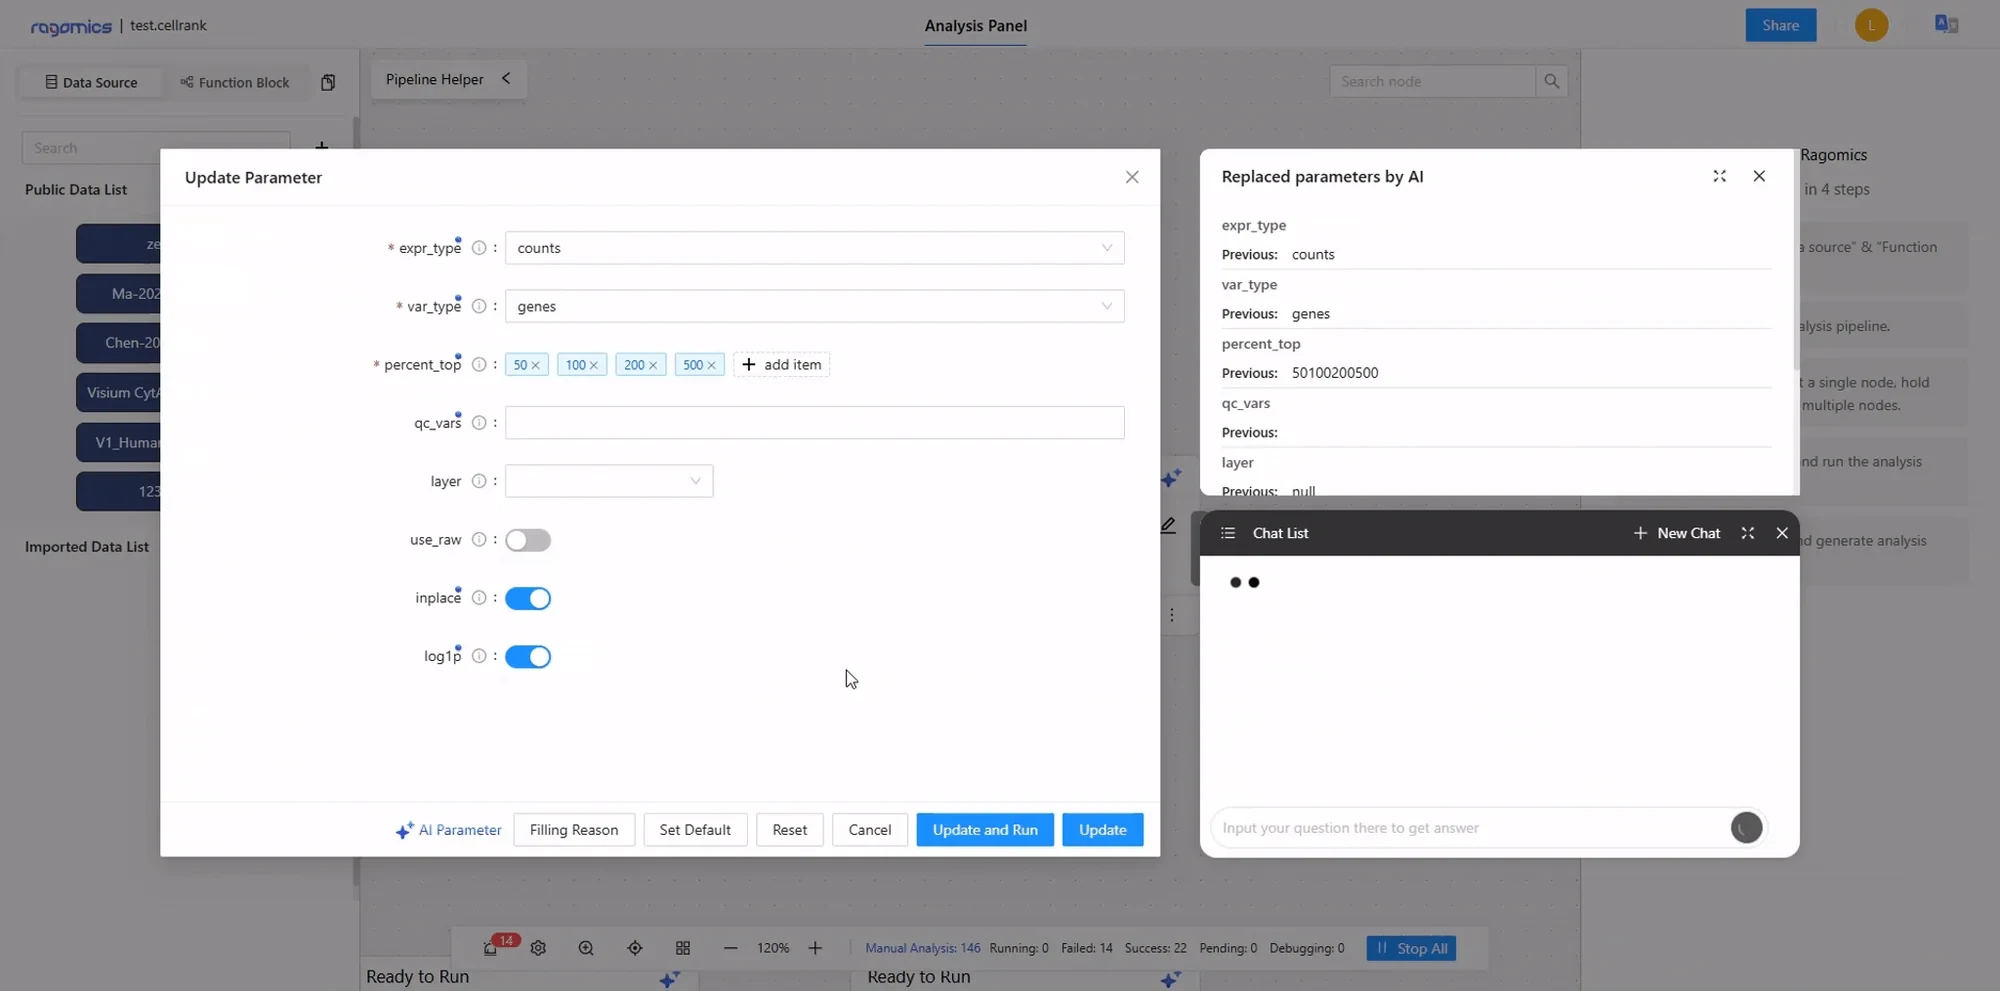
A language-model assistant sat beside the canvas. It explained results, diagnosed failed nodes, and filled in parameters. The user decided what to run.
Manage data
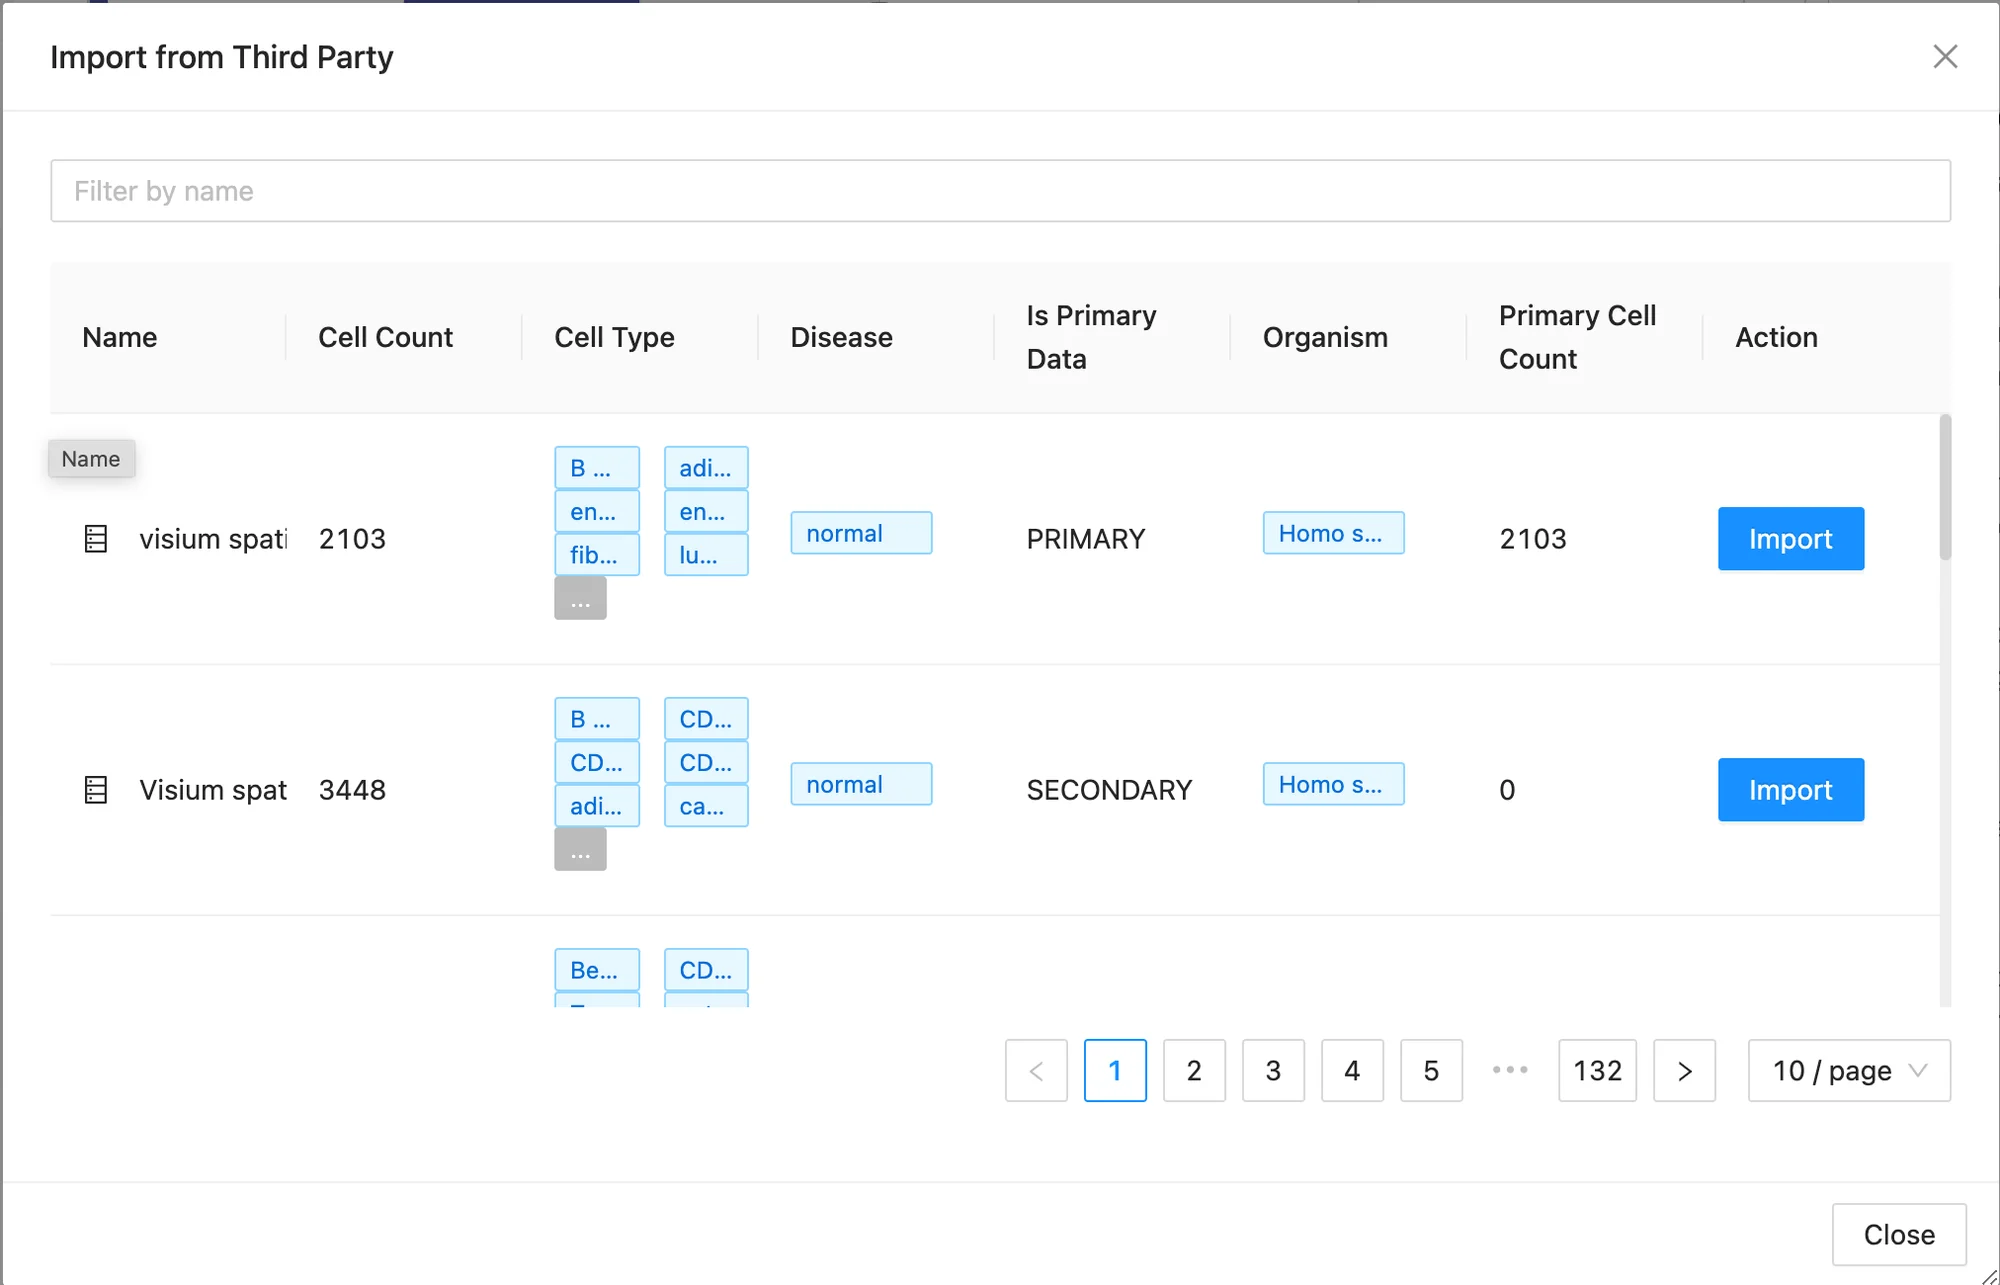
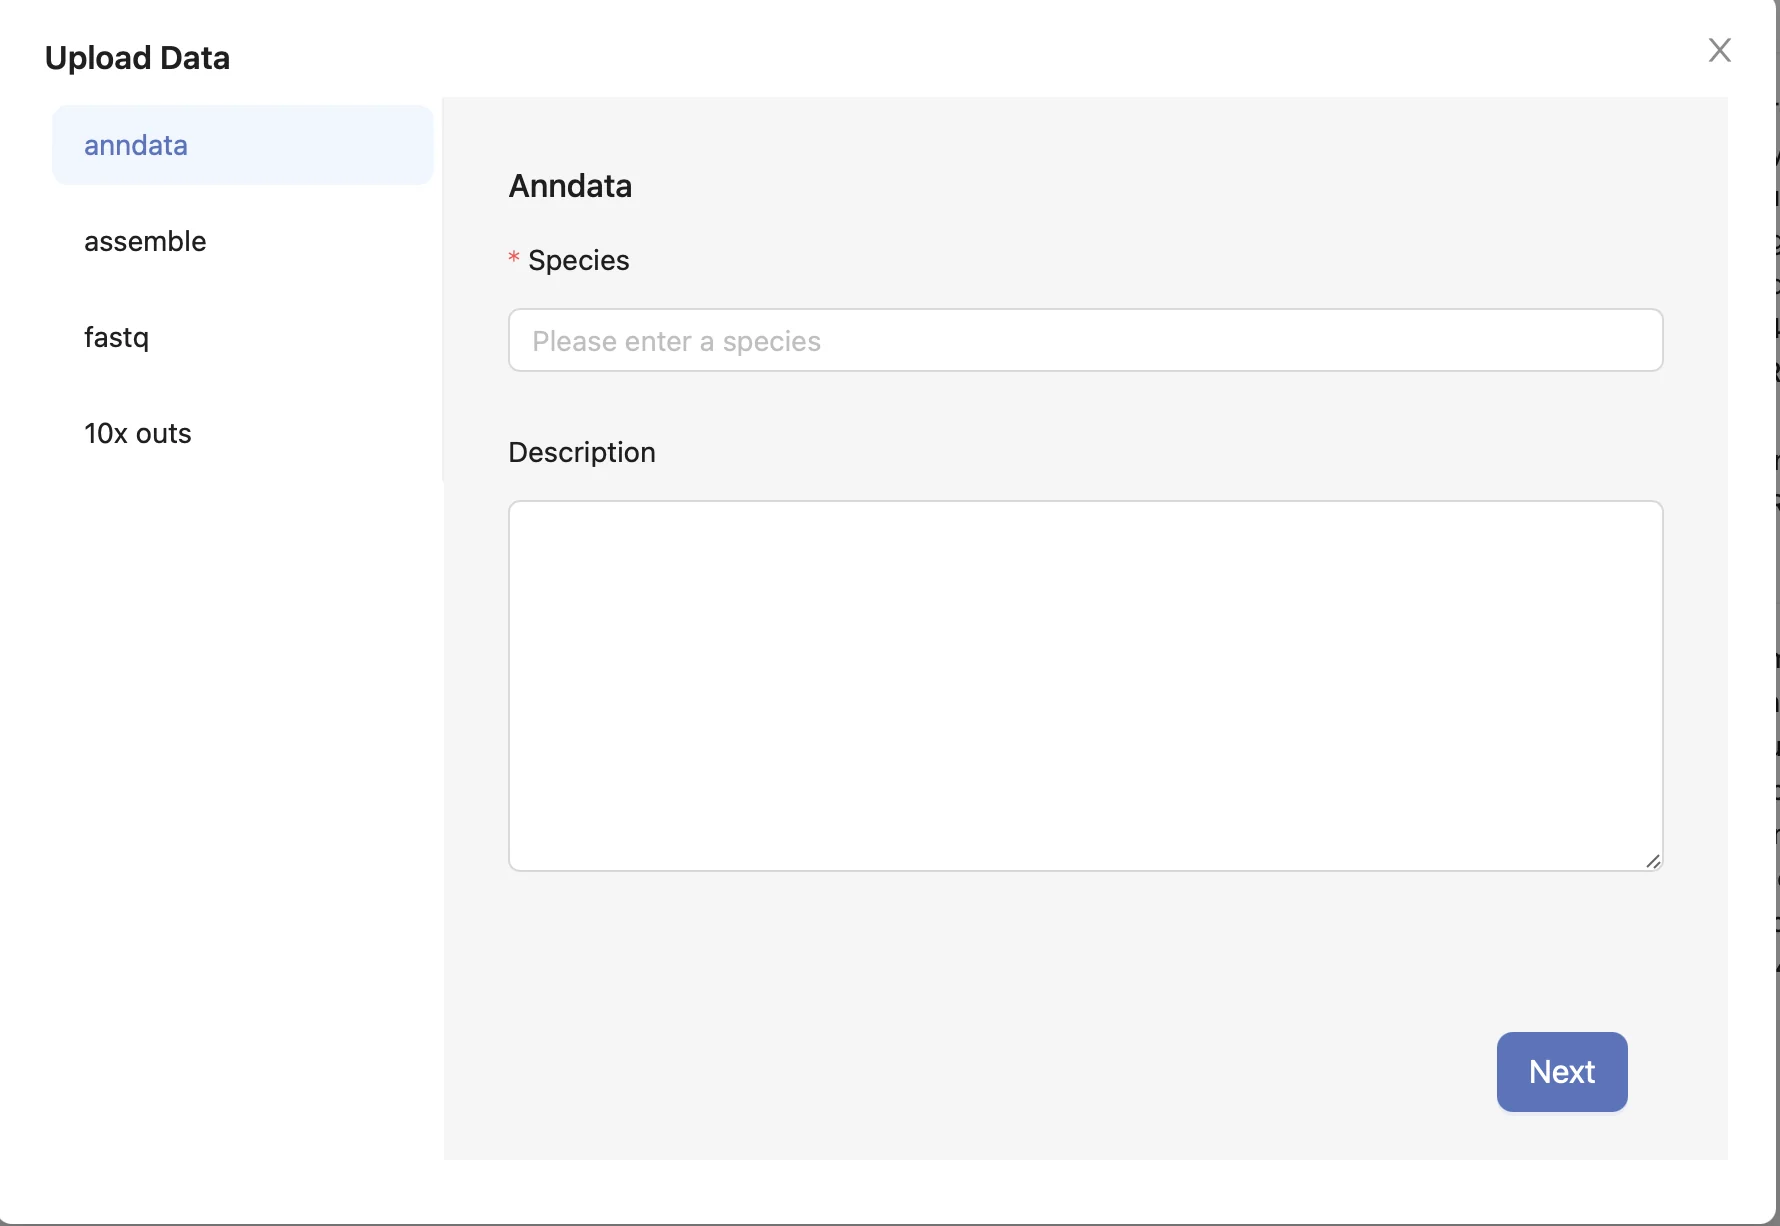
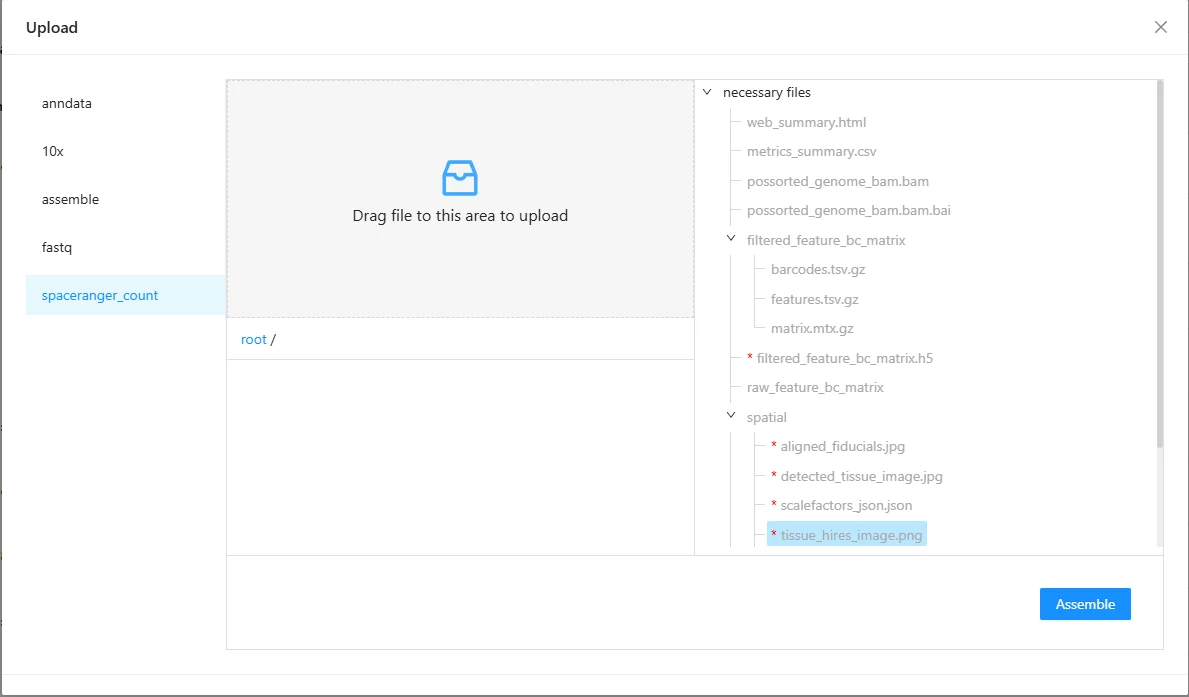
Public datasets could be imported in a click; users’ own data came in as AnnData, 10x outputs, component matrices or Space Ranger folders.