Case 1 · Clear cell renal cell carcinoma

Nominating spatial resistance niches in ccRCC from one open-ended question

The user asked a broad question about treatment resistance and named no mechanism. OmiCairn planned and ran a multi-step analysis across single-cell, spatial and bulk clinical data, and nominated a set of candidate resistance niches. A separate laboratory check on patient biopsies supported the plausibility of the proposed tissue architecture. It did not show cause or treatment response.

Hypothesis-generating Combinations nominated for testing, not recommended

1 The prompt

What the user asked

An open-ended natural-language request. It named a disease and the kinds of evidence to combine, but no predefined mechanism, gene or pathway.

User prompt

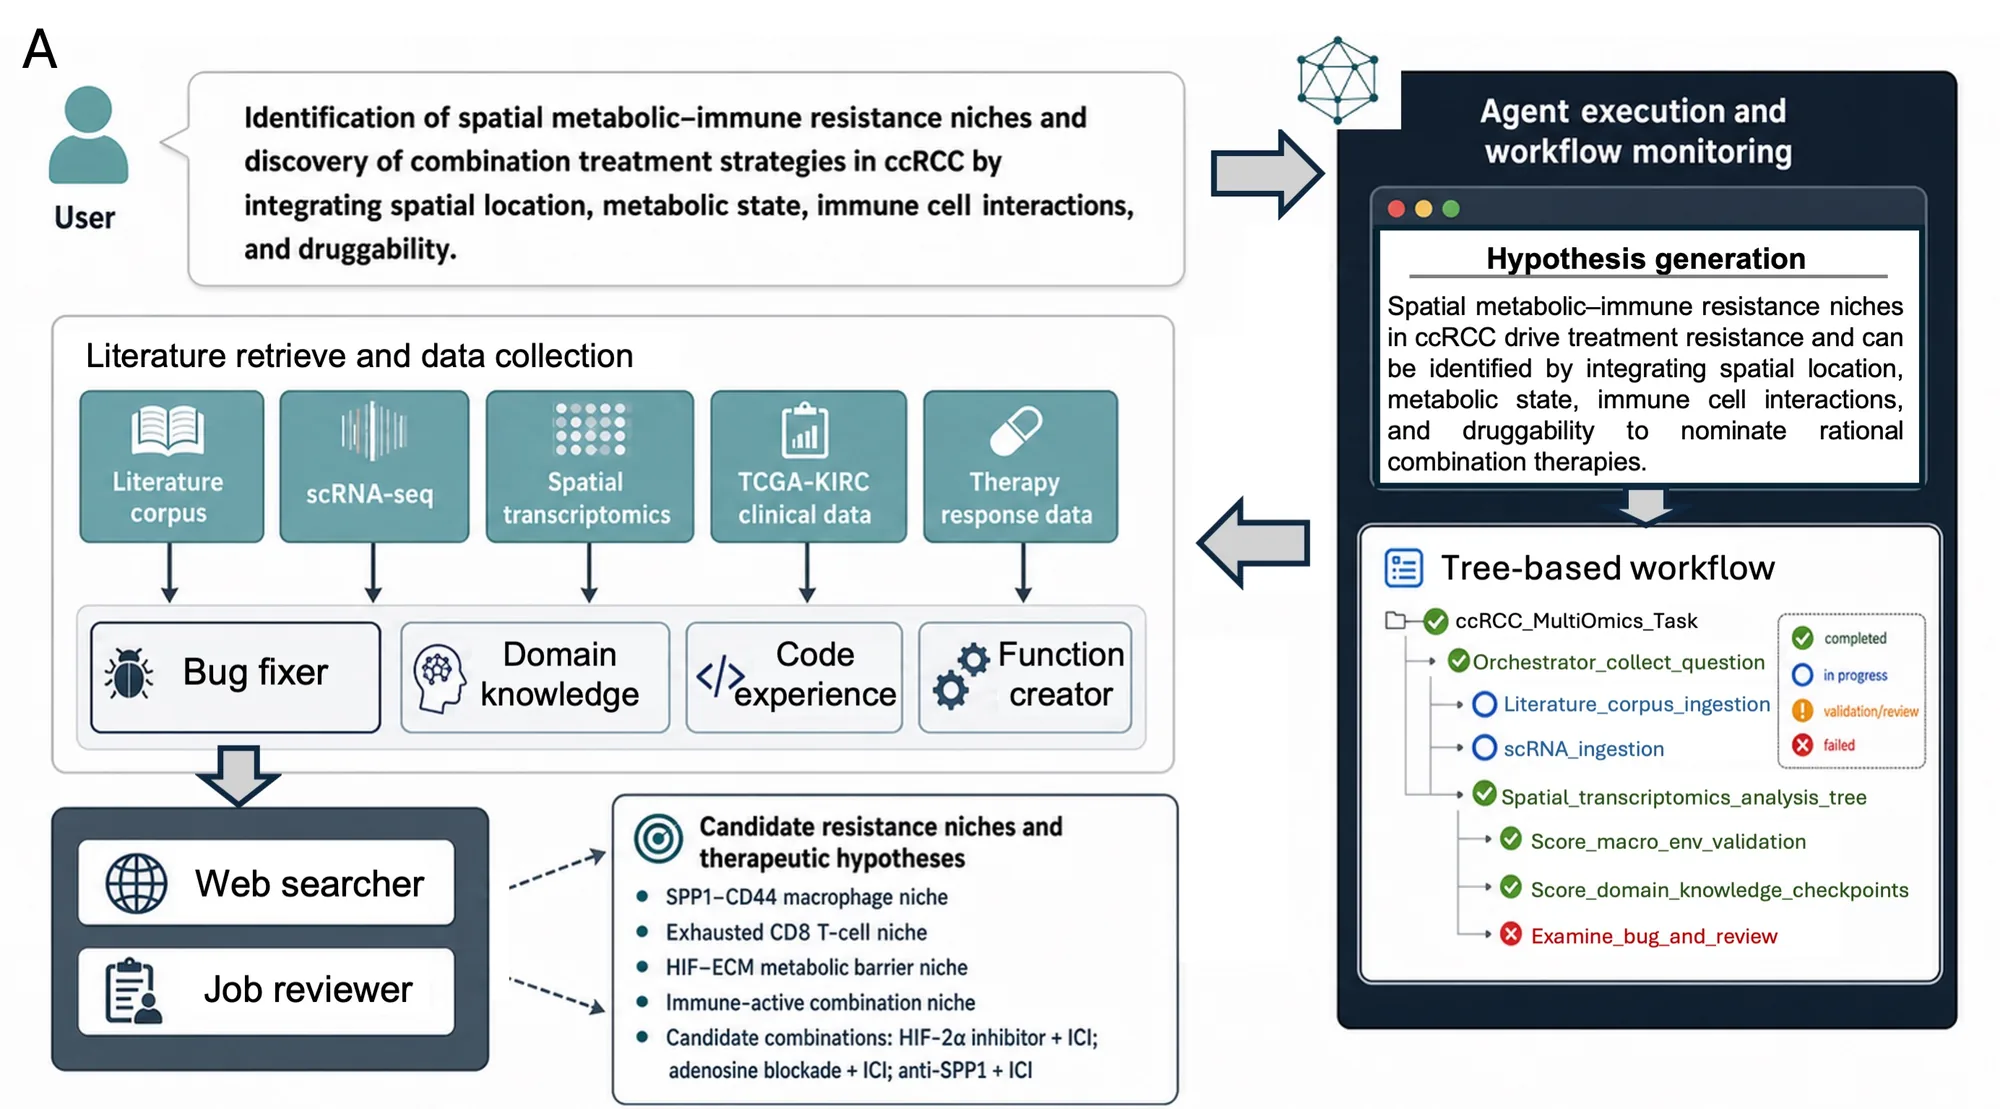
Identification of spatial metabolic–immune resistance niches and discovery of combination treatment strategies in ccRCC by integrating spatial location, metabolic state, immune cell interactions, and druggability.

As shown in Figure 5A of the OmiCairn manuscript.

OmiCairn's working hypothesis

Spatial metabolic–immune resistance niches in ccRCC drive treatment resistance and can be identified by integrating spatial location, metabolic state, immune cell interactions, and druggability to nominate rational combination therapies.

OmiCairn restated the request as a hypothesis to examine (Figure 5A). The analysis that follows can support or weaken it; it cannot prove that the niches drive resistance.

2 What OmiCairn did

A dependency-aware workflow, built from the prompt

OmiCairn turned the request into an analysis tree: each step's outputs feed the next, and every step keeps its code, parameters and logs. Supporting agents retrieved literature and domain knowledge, reused earlier code, created new functions, fixed failing steps and reviewed jobs.

  1. Gather literature and data

    Retrieved a literature corpus and collected the relevant datasets: single-cell RNA-seq, spatial transcriptomics, TCGA-KIRC clinical data and therapy-response data.

  2. Annotate cell states

    Defined tumour, myeloid and T-cell states from single-cell data (n = 19), including SPP1+ tumour-associated macrophages and exhausted CD8 T cells.

  3. Map spatial niches

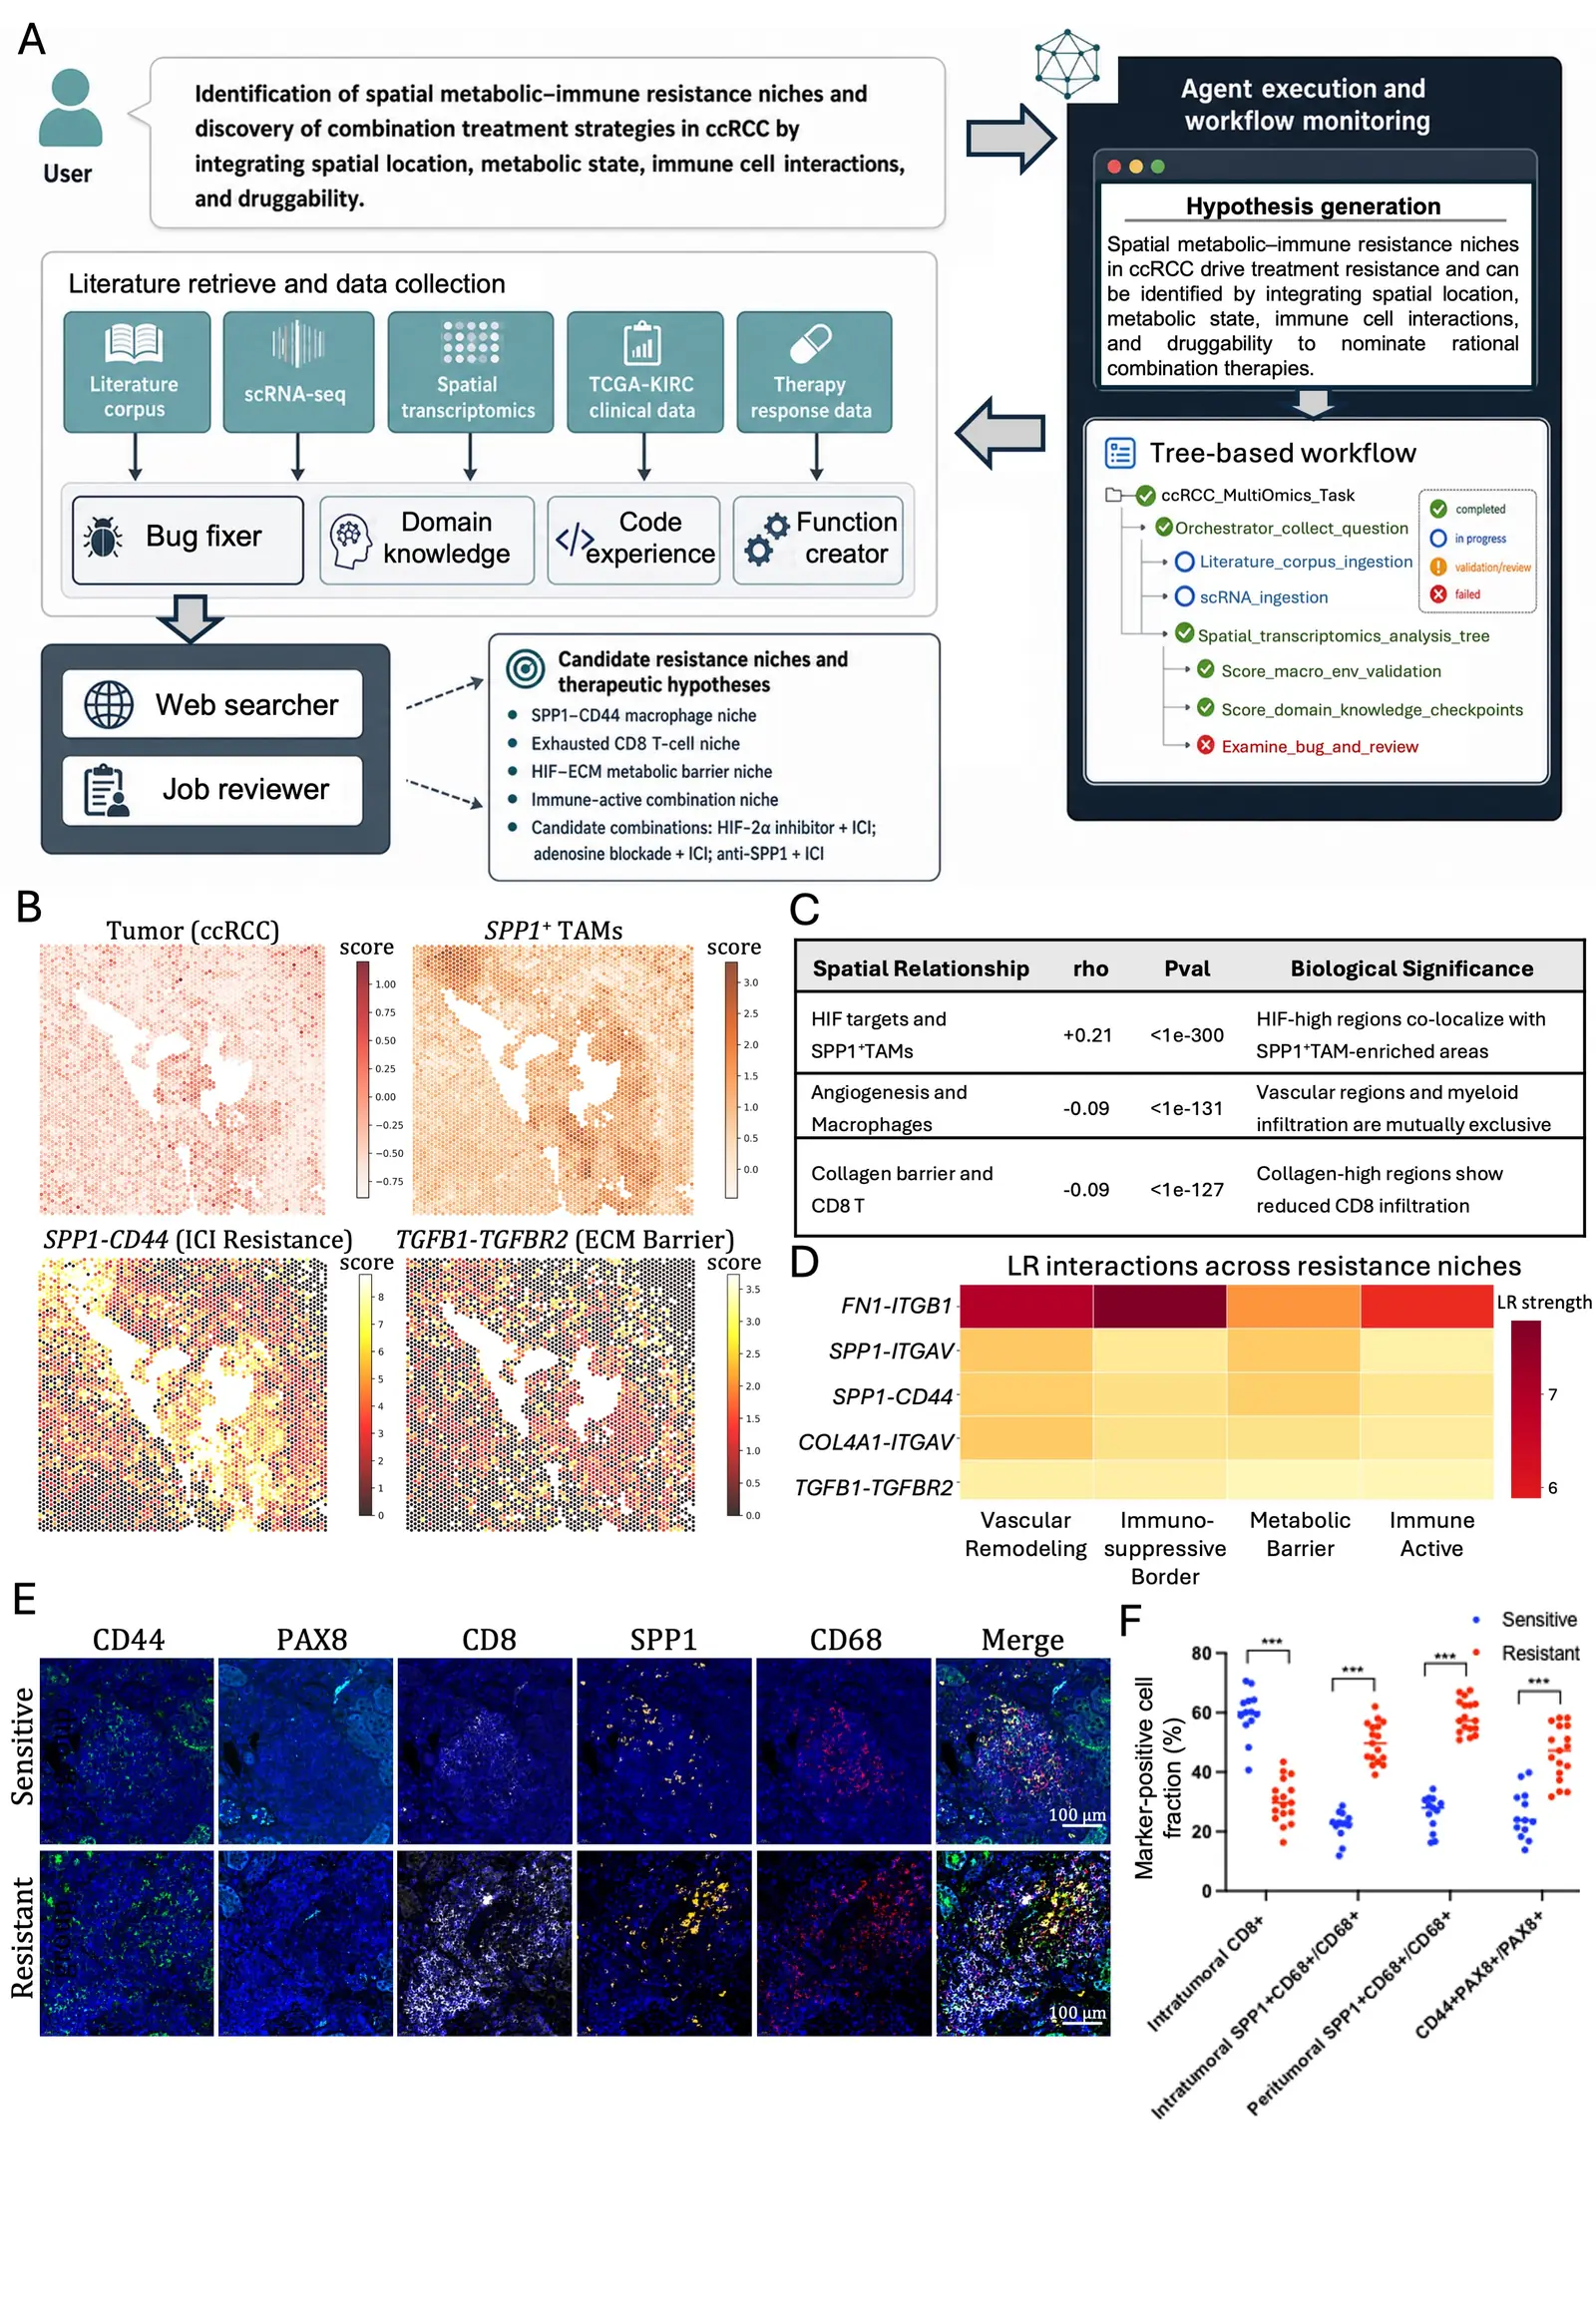
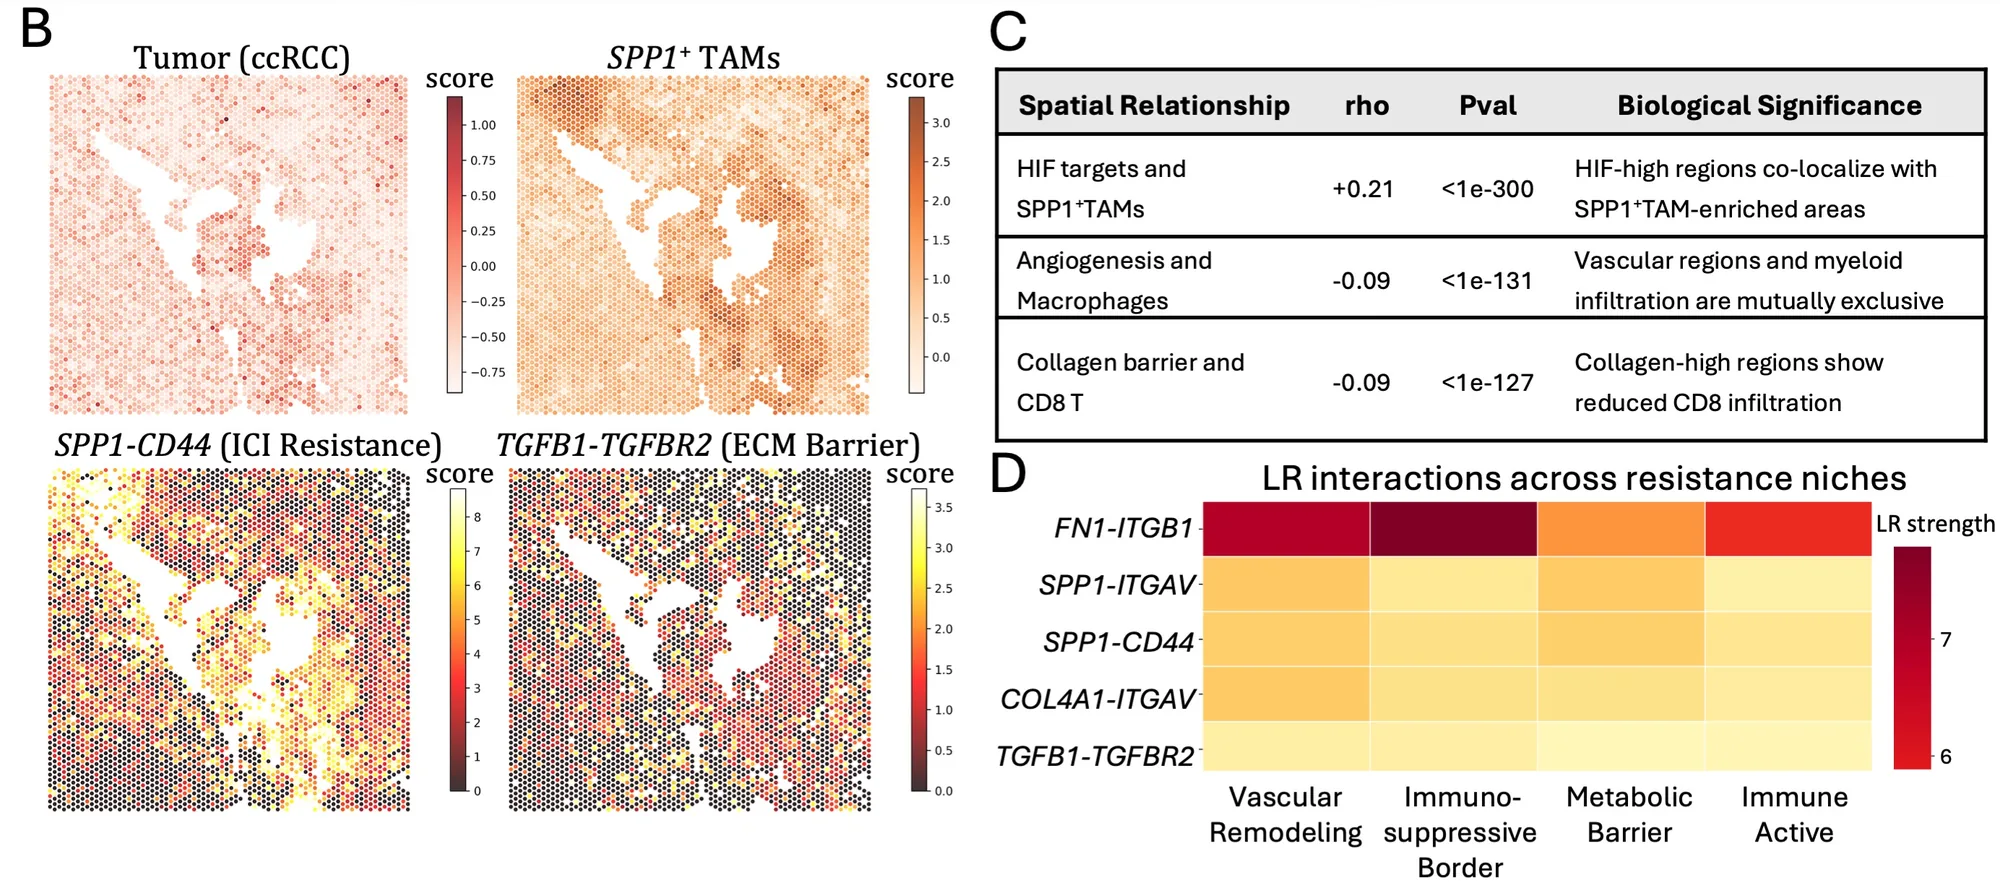
    Scored gene programmes on spatial transcriptomics sections (n = 24) and tested how they co-localize: HIF targets, macrophage, angiogenesis, collagen barrier and CD8 T-cell programmes.

    Scores from scanpy.tl.score_genes (Figure 5B)

  4. Infer ligand–receptor signalling

    Compared ligand–receptor interaction strength across four niche types: vascular remodelling, immunosuppressive border, metabolic barrier and immune-active.

  5. Test clinical association

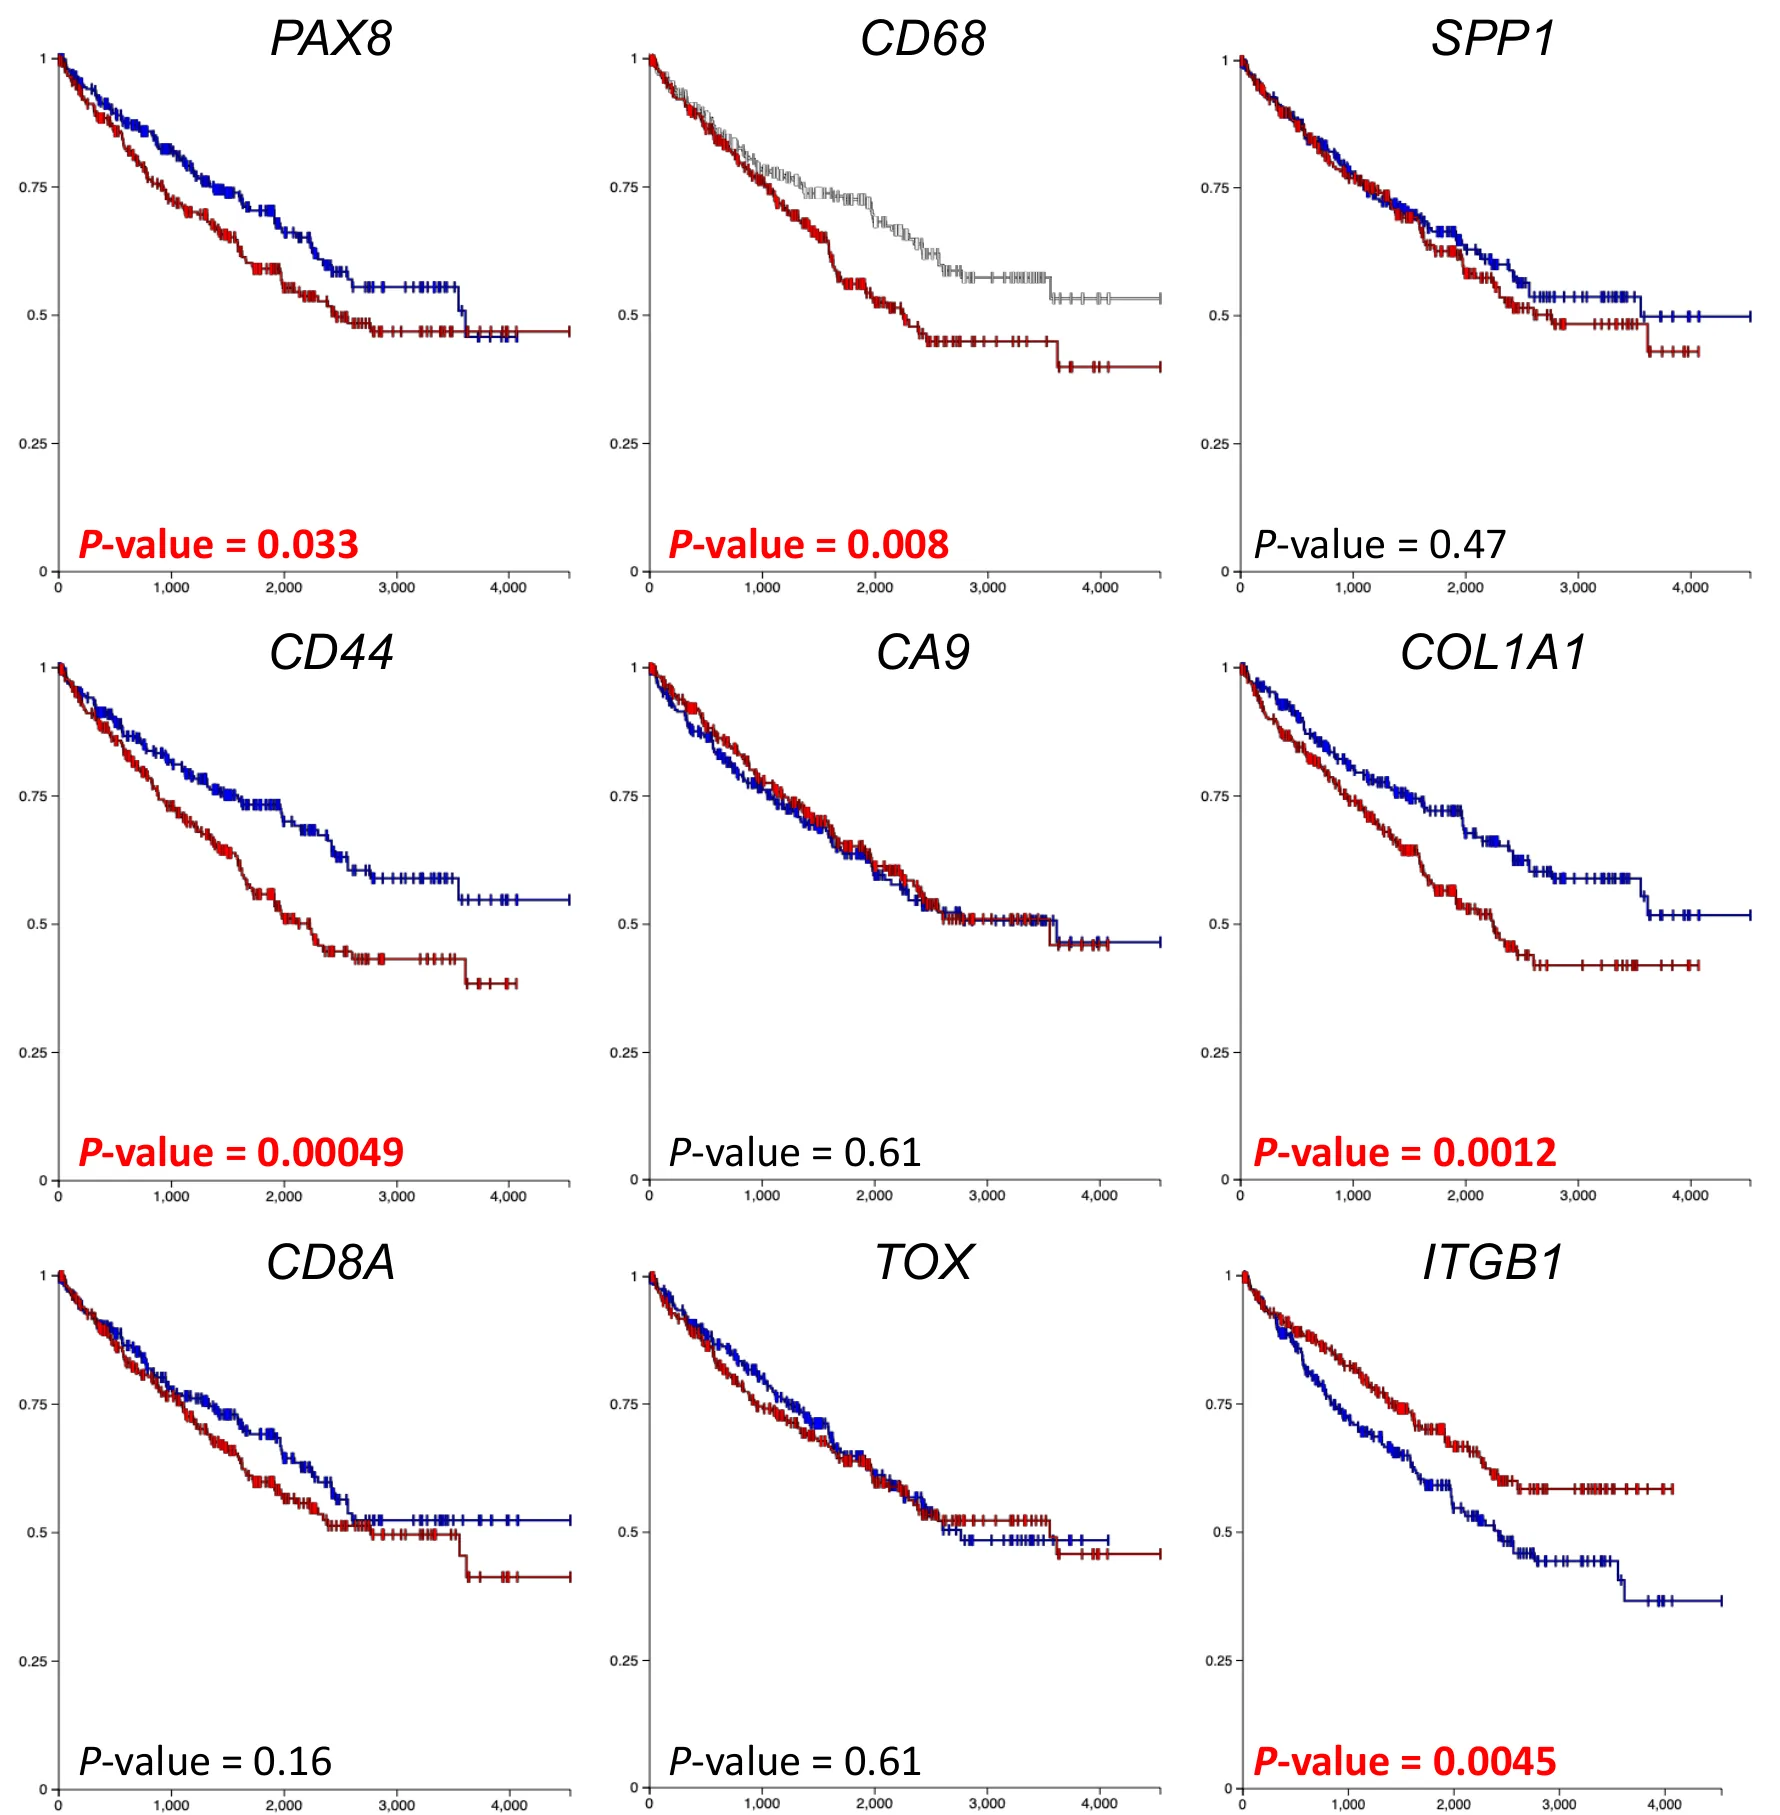
    Compared survival in TCGA-KIRC between patients above and below the median expression of nine niche marker genes (Kaplan–Meier).

  6. Nominate follow-up strategies

    Ranked candidate resistance niches and proposed drug combinations that target them, as hypotheses for later testing (Supplementary Figure 5).

  7. Protein-level check on patient tissue

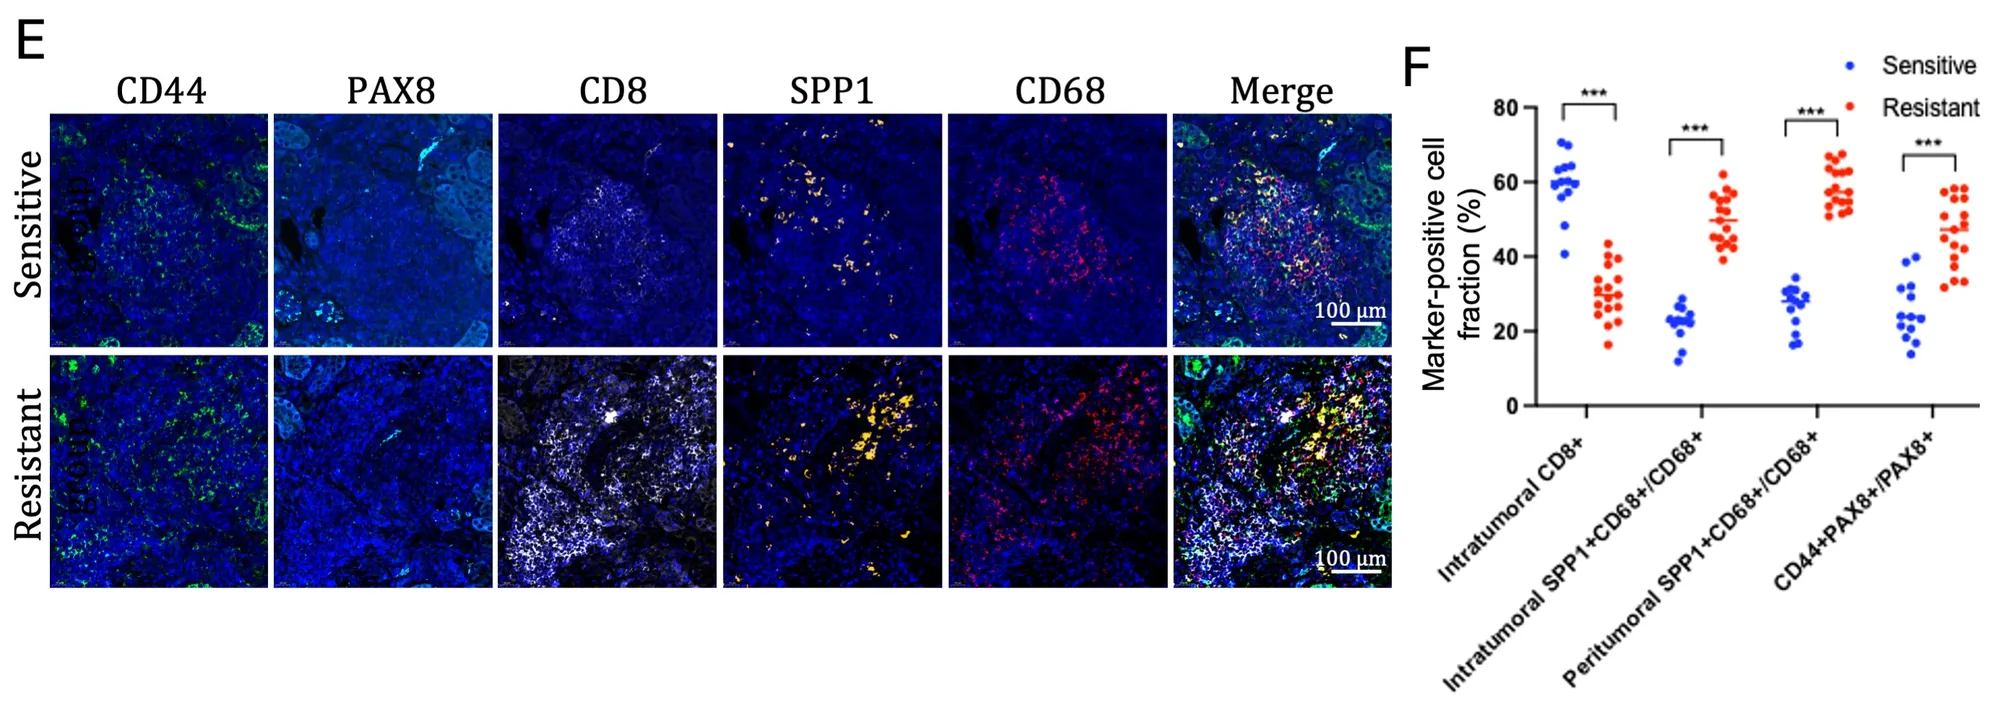
    Researchers stained ccRCC biopsies from treatment-sensitive and treatment-resistant tumours for CD44, PAX8, CD8, SPP1 and CD68, and quantified marker-positive cell fractions.

    Multiplex immunofluorescence; image analysis in Fiji; Wilcoxon test with Benjamini–Hochberg adjustment

Workflow schematic. A user prompt about spatial metabolic-immune resistance niches in ccRCC feeds literature retrieval and data collection (literature corpus, scRNA-seq, spatial transcriptomics, TCGA-KIRC clinical data, therapy response data), supported by bug fixer, domain knowledge, code experience, function creator, web searcher and job reviewer agents. A monitoring panel shows the generated hypothesis and a tree-based workflow with completed, in-progress and failed nodes. Output box lists candidate resistance niches and candidate combinations.
Figure 5A. The prompt, the data OmiCairn collected, the supporting agents, and the analysis tree with node status (completed, in progress, under review, failed). The output box lists the candidate niches and three candidate combinations, which are untested hypotheses.Figure from the OmiCairn manuscript (in preparation).

3 What it found

What it found, and how far the evidence goes

Five findings behind the nominated niches, plus what did not hold up. Each card shows the evidence and its strength. Most of it is correlational.

Candidate resistance features nominated

  • SPP1+ tumour-associated macrophages
  • Exhausted CD8 T cells
  • HIF-associated tumour programmes
  • ECM barrier signatures
  • Metabolic niche states
Finding 1Spatial correlation

SPP1+ macrophage areas overlap hypoxic, HIF-high regions

rho+0.21P < 10−300 · HIF targets vs SPP1+ TAM score

Spots with higher HIF-target scores also tend to have higher SPP1+ macrophage scores.

How strong: a weak positive correlation. The tiny P value reflects many spatial measurements, not a large effect. Association only.

Figure 5B–C

Finding 2Spatial correlation

Collagen-barrier regions hold fewer CD8 T cells

rho−0.09P < 10−127 · collagen barrier vs CD8 T score

Proposed as an ECM barrier that keeps CD8 T cells out of tumour regions.

How strong: very weak in the transcriptomic data. The laboratory check (below) found a lower intratumoral CD8+ fraction in resistant tumours, which fits an immune-excluded pattern.

Figure 5C, 5E–F

Finding 3Wording overstates

Angiogenesis and macrophage signals tend not to coincide

rho−0.09P < 10−131 · angiogenesis vs macrophage score

The figure table calls vascular regions and myeloid infiltration "mutually exclusive".

How strong: a correlation of −0.09 means a slight tendency, not exclusion. We show the number so readers can judge.

Figure 5C

Finding 4Ligand–receptor inference

Recurrent SPP1–CD44 and SPP1–ITGAV signalling across niches

5 interactions × 4 niche types. FN1–ITGB1 has the highest strength in every niche; SPP1–ITGAV, SPP1–CD44, COL4A1–ITGAV and TGFB1–TGFBR2 are lower.

Nominated as recurrent ECM and immune-regulatory interactions linking macrophages to tumour cells.

How strong: inferred from co-expression of ligand and receptor genes. No test statistic is reported for this panel.

Figure 5D

Finding 5Clinical association

The manuscript reports that high CD68, CD44 and ITGB1 go with lower survival in TCGA-KIRC

CD44 P = 0.00049 · ITGB1 P = 0.0045 · CD68 P = 0.008

Orthogonal bulk-tissue evidence for parts of the niche. SPP1 itself showed no survival difference (P = 0.47). In Supplementary Figure 4 the ITGB1 curves are arranged opposite to those of CD44 and CD68, so its direction cannot be confirmed from the figure.

How strong: single-gene median splits without reported adjustment for other clinical factors or for testing nine genes.

Supplementary Figure 4

What did not hold upNo association

Four niche genes showed no survival difference, including SPP1

SPP1 P = 0.47 · CA9 P = 0.61 · TOX P = 0.61 · CD8A P = 0.16

The ligand at the centre of the proposed niche, the hypoxia marker CA9 and the T-cell markers did not separate survival in TCGA-KIRC.

Why it matters: the clinical support is for parts of the niche, not the niche as a whole. We list nulls next to positives.

Supplementary Figure 4

Panel B: four spatial transcriptomics maps of one ccRCC section showing gene-set scores for tumour, SPP1-positive tumour-associated macrophages, SPP1-CD44 and TGFB1-TGFBR2. Panel C: table of three spatial relationships: HIF targets and SPP1-positive TAMs rho +0.21, P below 1e-300; angiogenesis and macrophages rho -0.09, P below 1e-131; collagen barrier and CD8 T rho -0.09, P below 1e-127. Panel D: heatmap of five ligand-receptor pairs across four niches (vascular remodeling, immunosuppressive border, metabolic barrier, immune active); FN1-ITGB1 is strongest in all four.
Figure 5B–D. (B) Spatial gene-set scores on one ccRCC section; colour bars show scanpy.tl.score_genes strength. (C) The three spatial correlations behind findings 1–3, with the system's own interpretation in the right column. (D) Ligand–receptor strength across four niche types.The "biological significance" column in panel C is OmiCairn's wording. With correlations of −0.09 to +0.21, read it as a direction of association, not as exclusion or co-localization in a strict sense.Figure from the OmiCairn manuscript (in preparation).

What it nominated for testing

  1. HIF-2α + ICI + anti-SPP1

    belzutifan + nivolumab + anti-OPN

  2. HIF-2α + ICI + adenosine block

    belzutifan + pembrolizumab + ciforadenant

  3. Vascular + ECM + ICI

    cabozantinib + bintrafusp alfa

  4. Multi-checkpoint + metabolic

    nivolumab + relatlimab + CB-839

  5. TAM reprogramming + vascular + ICI

    anti-TREM2 + lenvatinib + pembrolizumab

Restated from Supplementary Figure 5 of the OmiCairn manuscript. ICI: immune checkpoint inhibitor. The axes involved are HIF-2α, immune checkpoints, adenosine signalling, the SPP1–CD44 axis and ECM modulation.
4 How it was checked

Two independent checks: patient survival and patient tissue

The spatial findings came from transcriptomic data. Two checks looked at the same niche from other angles: survival in a large bulk cohort, and protein staining in tissue from treated patients.

Survival association in TCGA-KIRC

For each of nine niche marker genes, patients were split at the median expression and survival was compared between the two groups. We list all nine, including those with no association.

Kaplan–Meier comparison, high vs low expression (median split). 5 of 9 genes have P < 0.05.
GeneRole in the nicheP value
CD44SPP1 receptor; tumour cells0.00049
COL1A1Collagen / ECM barrier0.0012
ITGB1Integrin receptor0.0045
CD68Macrophages0.008
PAX8Tumour epithelium0.033
CD8ACD8 T cells0.16
SPP1Macrophage ligand (osteopontin)0.47
CA9Hypoxia / HIF target0.61
TOXT-cell exhaustion0.61

Filled dot: P < 0.05. The manuscript text states that high CD68, CD44 and ITGB1 expression goes with lower survival. The source figure does not label which curve is the high-expression group, and its ITGB1 panel has the red and blue curves the other way round from CD44 and CD68, so either the colours or the stated ITGB1 direction is inconsistent. We give no direction for the other genes. Cohort size: n = 613 in the main text; the supplementary figure legend states n = 950.

Nine Kaplan-Meier survival plots for TCGA kidney clear cell carcinoma, one per gene, each comparing two expression groups. P values: PAX8 0.033, CD68 0.008, SPP1 0.47, CD44 0.00049, CA9 0.61, COL1A1 0.0012, CD8A 0.16, TOX 0.61, ITGB1 0.0045.
Supplementary Figure 4. Survival probability over time (days) for patients split at the median expression of each gene. Values are listed in the table.Figure from the OmiCairn manuscript (in preparation).

Multiplex immunofluorescence on patient biopsies

Panel E: representative multiplex immunofluorescence images of a sensitive and a resistant ccRCC biopsy, channels CD44, PAX8, CD8, SPP1, CD68 and merge, 100 micrometre scale bar. Panel F: dot plot of marker-positive cell fractions in percent for sensitive and resistant samples; intratumoral CD8-positive fraction is lower in resistant samples, and SPP1-positive CD68-positive macrophage fractions (intratumoral and peritumoral) and CD44-positive PAX8-positive tumour cell fraction are higher; all comparisons marked P below 0.001.
Figure 5E–F. (E) Representative images: green CD44, cyan PAX8, white CD8, yellow SPP1, red CD68, blue DAPI. (F) Marker-positive cell fractions per sample; bars show the mean; *** P < 0.001.Figure from the OmiCairn manuscript (in preparation).

Biopsy sections from ccRCC tumours that were sensitive (n = 17) or resistant (n = 13) to treatment were stained for CD44, PAX8 (tumour epithelium), CD8, SPP1 and CD68 (macrophages), with DAPI for nuclei. This was laboratory work done by researchers, outside the automated workflow.

In resistant tissue, CD44, SPP1 and CD68 signals were stronger. CD8+ cells were abundant but sat mainly in PAX8-low regions instead of inside PAX8+ tumour nests, consistent with an immune-excluded architecture.

Resistant vs sensitive tumours. Wilcoxon test, Benjamini–Hochberg adjusted.
Cell fractionResistantP
Intratumoral CD8+Lower< 0.001
Intratumoral SPP1+CD68+ / CD68+Higher< 0.001
Peritumoral SPP1+CD68+ / CD68+Higher< 0.001
CD44+PAX8+ / PAX8+Higher< 0.001

What this supports: the plausibility of the nominated tissue architecture at the protein level. What it does not show: that the niche causes resistance, or how any patient would respond to a therapy.

5 Limits

Limits and what this case does not claim

The case shows that OmiCairn can turn an open question into a traceable set of testable hypotheses. It does not establish a mechanism.

  • Association, not cause.The spatial correlations, ligand–receptor inferences and survival splits are associations. The protein-level assessment "did not establish causality or therapeutic response" (manuscript).
  • Weak correlations.All three spatial correlations are small in size (rho between −0.09 and +0.21). Very small P values here come from many measurements.
  • No treatment was tested.The five combinations are nominated hypotheses. They are not clinical recommendations and must not be read as advice.
  • Simple survival analysis.Median splits, one gene at a time, with no reported adjustment for stage, grade or multiple testing. SPP1, the centre of the proposed niche, showed no survival difference.
  • Small tissue cohort.30 biopsies in two groups. The case description does not state which treatment or which response criteria defined the sensitive and resistant groups. The images in Figure 5E are selected representative examples.
  • Not a new discovery.SPP1+ macrophages co-localizing with CD44+ programmes have been reported before in several tumours. Recovering a known axis from an open prompt is a plausibility check of the workflow.
  • Not yet published.This case comes from the OmiCairn manuscript, which is in preparation. Treat it as preliminary.
  • Reported counts differ.The TCGA-KIRC cohort is n = 613 in the main text and n = 950 in the supplementary figure legend. We show both rather than choose one.

6 Figures

Figure 5, complete

Panels A to F are shown next to the sections above. The complete figure, with its caption, opens at full size.

Thumbnail of Figure 5 panel A; select it to open the complete Figure 5 at full size.
Figure 5. OmiCairn nominates spatial metabolic–immune resistance niches and candidate combination strategies in ccRCC. (A) Overview of the agentic workflow: from a natural-language task, OmiCairn integrates literature retrieval and datasets into a dependency-aware analysis tree for cell-state annotation, spatial niche mapping, ligand–receptor analysis, clinical association and therapeutic hypothesis generation. (B) Nominated and prioritized spatial metabolic–immune resistance hypotheses; colour bars show scanpy.tl.score_genes strength. (C) Statistical summary linking spatial resistance features with biological interpretation. (D) Ligand–receptor interactions across spatial resistance niches. (E) Representative multiplex immunofluorescence: green CD44, cyan PAX8, white CD8, yellow SPP1, red CD68, blue DAPI. (F) Marker-positive cell fractions in sensitive (n = 17) and resistant (n = 13) tumours; individual samples, bars at the mean; *** P < 0.001. Open the complete figureThe "candidate combinations" in panel A are hypotheses nominated for testing, not treatment recommendations.Figure from the OmiCairn manuscript (in preparation).

7 Data sources

Where the data came from

All computational inputs are public. The tissue study used patient biopsies under ethics approval with written informed consent; no patient-level data are shown here.

Single-cell RNA-seq
GEO GSE207493
Spatial transcriptomics
GEO GSE175540
Clinical validation cohort
GDC TCGA-KIRC, accessed via UCSC Xena
Patient biopsies
ccRCC renal tissue sections for multiplex immunofluorescence; approved by an institutional ethics committee, with written informed consent. Not publicly released.
Figures and text
OmiCairn manuscript (in preparation): Results, Case 1; Figure 5; Supplementary Figures 4 and 5; Methods; Data availability.