Authors: OmiCairn Autonomous Research Agent
Abstract
ΔAUC = +0.026 (95% CI −0.066 to +0.118; p_directional = 0.290; n = 97 donors): Geneformer-V2-104M zero-shot embeddings did not outperform a log-CPM-PCA-LR baseline for donor-level Parkinson's disease (PD) classification, failing the pre-registered threshold of ΔAUC ≥ 0.05. Single-cell foundation models have been proposed as generalizable disease-stratification tools, yet no benchmark has placed PD on the growing null-result map alongside AML and COVID-19. We introduce PD-FM-BENCH, a pre-registered protocol applied to the Fullard 2024 multi-region snRNA-seq atlas (73 PD, 24 control; five brain regions). Geneformer-V2-104M achieved leave-one-out AUC = 0.775 (95% CI 0.680–0.870) versus 0.749 (95% CI 0.640–0.859) for log-CPM-PCA-LR; the pre-registered H1 threshold (ΔAUC ≥ 0.05) was not met. An N = 1,000-permutation null confirmed real disease signal in Geneformer embeddings (empirical p < 0.001), but not superiority over the baseline. Zero-shot transfer to the Adams midbrain atlas (n = 13) yielded Geneformer AUC = 0.694 (95% CI 0.324–1.000) versus baseline AUC = 0.944 (95% CI 0.819–1.000). PD joins AML and COVID-19 as conditions where zero-shot FM embeddings do not outperform log-CPM-PCA-LR; the validated PD-FM-BENCH protocol is available for adoption.
(175 words)
Introduction
Single-cell RNA sequencing has transformed our ability to characterise the cellular architecture of the human brain in health and disease. For Parkinson's disease (PD), a progressive neurodegenerative disorder affecting more than six million people worldwide,15 a succession of large-scale snRNA-seq atlases has catalogued the transcriptomic diversity of dopaminergic neurons and the glial populations that support them.6,7,8 These atlases offer an unprecedented opportunity to stratify donors by disease status at the single-cell level — a capability that could accelerate biomarker discovery and patient selection for clinical trials.
Foundation models trained on tens of millions of single cells have been proposed as a generalizable solution to this stratification challenge. Geneformer, introduced by Theodoris et al. in 2023, employs a transformer architecture pre-trained on 30 million human single-cell transcriptomes to encode gene expression profiles as context-dependent embeddings.1 The 95-million-cell update (Geneformer-V2-104M; Chen et al. 2024, bioRxiv preprint) extended pre-training further and refined the model architecture.2 scGPT, introduced by Cui et al. in 2024, demonstrated competitive performance across several single-cell analysis tasks and claimed disease-relevant cell-type and pathway representations.3 Both models have been promoted as tools for zero-shot disease stratification — that is, without any disease-label supervision during model training.
Despite these claims, systematic benchmarks have returned sobering results in oncology and immunology. Boiarsky et al. showed that Geneformer zero-shot embeddings did not outperform a naive baseline for AML patient stratification in the BeatAML cohort.4 Kedzierska et al. extended this finding across multiple cell atlases and disease contexts, demonstrating that zero-shot foundation models generally do not exceed simpler methods including log-CPM-PCA-LR, Harmony, or HVG-based embeddings for patient-level classification.5 Wong et al. separately demonstrated that simple baseline controls frequently match or exceed deep-learning models for biological prediction tasks when the feature set is well-matched to the task.10 Critically, neurodegenerative disease has not yet been placed on this benchmark map. PD represents an important test case: large, well-curated multi-donor atlases are publicly available,6,7,8 the disease has a binary diagnostic label (PD versus control), and prior work on dopaminergic neuron subtypes suggests biologically meaningful transcriptomic structure that a foundation model might capture.7
Here we introduce PD-FM-BENCH, a pre-registered benchmark protocol that places PD on the foundation-model stratification map. We applied Geneformer-V2-104M zero-shot embeddings to the Fullard 2024 multi-region snRNA-seq atlas6 and compared donor-level LOO classification AUC against a log-CPM-PCA-LR baseline, with additional zero-shot cross-atlas generalisation to an independent midbrain atlas9 and subsampling robustness testing. The primary hypothesis (H1) — that FM embeddings outperform log-CPM-PCA-LR by ΔAUC ≥ 0.05 — was not supported. The validated PD-FM-BENCH protocol provides a reusable, pre-registered standard for FM evaluation in PD and related neurodegenerative diseases.
(~595 words)
Results
Geneformer does not outperform log-CPM-PCA-LR for donor-level PD classification (H1) (Fig. 3)
ΔAUC = +0.026 (95% CI −0.066 to +0.118; Fig. 3b), a value statistically indistinguishable from zero and below the pre-registered threshold of ΔAUC ≥ 0.05 — the primary hypothesis H1 is NOT SUPPORTED. Geneformer-V2-104M achieved LOO AUC = 0.775 (95% CI 0.680–0.870) versus 0.749 (95% CI 0.640–0.859) for log-CPM-PCA-LR (Fig. 3a); the directional test yielded p_directional = 0.290 (paired bootstrap, B = 5,000, seed = 42), far exceeding the pre-registered significance threshold of p < 0.05. Brier scores were nearly identical (Geneformer: 0.164; baseline: 0.163; Fig. 5b), confirming that neither model has a calibration advantage. Permutation testing (N = 1,000; null 95th-percentile AUC = 0.626) placed the observed Geneformer AUC well above the null 95th percentile (empirical p < 0.001; Fig. 3d), confirming that the Geneformer embedding detects a real disease-associated signal. Although the Geneformer AUC point estimate marginally exceeded the pre-registered 0.75 threshold (0.775 vs. 0.75), the ΔAUC requirement was the binding constraint — a foundation model that merely matches the baseline's absolute performance does not constitute a meaningful advance.
Foundation-model and baseline embedding quality (Fig. 1, Fig. 2)
Gene vocabulary coverage was 17,220/17,266 (99.7%) of Fullard atlas genes in the Geneformer-V2-104M token dictionary (Fig. 2c), indicating negligible tokenisation loss. The study design is shown schematically in Fig. 1. Zero-shot Geneformer-V2-104M inference on 9,700 cells (100 cells per donor × 97 donors) required 461 s on a single workstation (MPS backend; Fig. 2d). Principal component analysis of donor-mean Geneformer embeddings showed no clear separation between PD and control donors in the top 20 PCs (Fig. 2b), consistent with the near-baseline classification performance reported in the preceding section.
Zero-shot cross-atlas generalisation (H5) and scGPT staging failure (Fig. 4)
AUC = 0.694 (95% CI 0.324–1.000) for zero-shot Geneformer on the Adams 2024 midbrain atlas (13 donors: 4 PD, 9 control; Fig. 4a) met the pre-registered H5 threshold (AUC ≥ 0.65). However, a symmetric log-CPM-PCA-LR baseline — trained on all 97 Fullard donors and applied zero-shot to the same 13 Adams donors — achieved AUC = 0.944 (95% CI 0.819–1.000; Fig. 4a), a ΔAUC of −0.250 favouring the baseline. The baseline CI lower bound (0.819) exceeds the Geneformer Adams CI lower bound (0.324), consistent with a meaningful point-estimate difference; however, both estimates carry wide CIs driven by the small sample size (n = 13) and the finding should be interpreted cautiously. scGPT staging failed in this analysis cycle: the scgpt Python package was absent from the analysis environment, model weights were not staged locally, and a HuggingFace Hub query for bowang-lab/scGPT-human returned a 401 authentication error (Fig. 4b); the full error trace is recorded in the run's results record. The deferred H3 fine-tuning transfer (Kamath 2022, GSE178265) and Wang 2024 zero-shot evaluation are likewise reported as deferred due to missing data resources (Fig. 4c–d).
Subsampling robustness (H4) and benchmark placement (Fig. 5)
ΔAUC ranged from −0.018 at 25 cells per donor (95% CI −0.103 to +0.072) to +0.026 at 100 cells per donor (95% CI −0.065 to +0.120), a range of 0.044, within the pre-registered ±0.05 stability criterion (Fig. 5a); H4 is declared STABLE. However, the direction reversal at 25 cells per donor (ΔAUC < 0) indicates that the small positive point estimate at 100 cells per donor is fragile at the lowest evaluated sampling density. Placing this study alongside Boiarsky et al. 2024 (AML, n ≈ 451; ΔAUC ≈ −0.01) and Kedzierska et al. 2025 (COVID-19, n ≈ 183; ΔAUC ≈ −0.02) confirms that PD occupies the same near-zero ΔAUC region as other diseases for which zero-shot FMs have been evaluated (Fig. 5c).
Discussion
Zero-shot Geneformer-V2-104M embeddings did not improve donor-level PD classification over log-CPM-PCA-LR on the Fullard 2024 multi-region snRNA-seq atlas (ΔAUC = +0.026, 95% CI −0.066 to +0.118, p_directional = 0.290), with both models achieving LOO AUC ≈ 0.75. This result is more precisely described as inconclusive with respect to the pre-registered effect size than as a confident null: post-hoc power analysis places the study at approximately 19% power to detect ΔAUC = 0.05, and the 95% CI upper bound (+0.118) is more than twice the threshold. H1 is not supported under the pre-specified decision rule. The finding extends the Boiarsky/Kedzierska4,5 observation to — to our knowledge — the first neurodegenerative disease context, placing PD alongside AML and COVID-19 where zero-shot foundation models do not outperform a simple dimensionality reduction pipeline.
Mechanism and interpretation. The Fullard 2024 atlas spans five brain regions (prefrontal cortex, motor cortex, visual cortex, globus pallidus, dorsal motor nucleus of the vagus) across 97 donors. Only the dorsal motor nucleus of the vagus (DMnX) is a primary PD pathology site, with its dopaminergic subpopulation accumulating Lewy bodies at early Braak stages;23 the remaining four regions are minimally or indirectly involved in PD pathology at most disease stages.23 Donor-mean aggregation across 100 nuclei per donor — spanning dopaminergic, cholinergic, glutamatergic, and GABAergic populations — blends the disease-informative signal from the minor DMnX subpopulation with dominant non-PD-informative variance. Cell-type-stratified analyses have demonstrated that PD disease signal concentrates in specific dopaminergic subpopulations — for example, the AGTR1+ neurons that selectively degenerate in PD7 — a specificity that donor-mean embeddings suppress. Geneformer, pre-trained on diverse cell types and tissues, has no mechanism to upweight PD-informative cells in a zero-shot setting.1 The log-CPM-PCA-LR baseline, selecting the top 2,000 HVGs per LOO fold, adapts to atlas-specific transcriptomic variance without the inductive bias of the pre-trained model — explaining comparable performance. This interpretation aligns with Kedzierska et al.'s finding that HVG-based embeddings outperform FMs in zero-shot discovery contexts5 and with Wong et al.'s observation that simple controls frequently match deep-learning models when the feature set is well-matched to the task.10
Relation to prior benchmarks. Boiarsky et al. reported ΔAUC ≈ 0 for Geneformer on AML patient stratification;4 Kedzierska et al. extended this finding across COVID-19 and multiple other disease contexts.5 Our result places PD on this benchmark map. A shared structural feature — complex polygenic disease phenotype defined at the donor level, model pre-trained without disease-label supervision — may underlie the consistent null across diseases.
Limitations
First, the scGPT arm was deferred (package absent, weights not staged, HuggingFace 401 error); H1 was evaluated with Geneformer only and the "which model wins" comparison remains open. Second, computational constraints limited cell sampling to 100 cells per donor — 50- to 500-fold below pre-registered levels; the H4 trend (ΔAUC monotonically increasing from −0.018 at 25 cells to +0.026 at 100 cells) cannot be extrapolated to pre-registered levels without cloud GPU access. Third, the permutation null used a simplified LOO (fixed C = 1.0, liblinear, N = 1,000); the empirical p < 0.001 confirms above-chance signal rather than serving as a calibrated p-value. Fourth, the Fullard atlas excludes the substantia nigra pars compacta, where the most PD-vulnerable dopaminergic neurons reside;7 an SNpc-specific atlas may expose disease signal diluted here. Fifth, the Adams cross-atlas comparison (H5) rests on n = 13 donors, yielding wide CIs; the baseline-dominates-Geneformer finding is suggestive but not conclusive. Sixth, the cohort is class-imbalanced (73 PD: 24 control, 3:1 ratio): a single misclassified control shifts AUC by ≈ 0.042 — nearly the entire ΔAUC point estimate. Seventh, the study has approximately 19% power to detect ΔAUC = 0.05; the minimum detectable effect at 80% power is ΔAUC ≈ 0.162. Eighth, donor-mean aggregation across all cell types suppresses cell-type-specific disease signal; a cell-type-stratified analysis would directly test the dilution mechanism proposed here. Ninth, demographic covariates (age, sex, post-mortem interval) were not controlled; a demographic-only logistic regression would be required to confirm that AUC ≈ 0.75 reflects disease biology rather than cohort-structure confounders.
Falsifiable predictions and next steps. If future work applies PD-FM-BENCH to an SNpc-specific dopaminergic atlas with ≥ 50 PD donors and ≥ 1,000 cells per donor — conditions matching the Boiarsky 2024 AML cohort in statistical power — and Geneformer again fails to exceed log-CPM-PCA-LR by ΔAUC ≥ 0.05, then the null result generalises beyond atlas-composition limitations to dopaminergic neuron biology. If supervised fine-tuning on a PD-labelled atlas (completing the deferred H3 hypothesis) yields AUC ≥ 0.80 on an independent cohort, this would confirm that pre-trained representations are fine-tune-useful but not zero-shot-useful for PD. The PD-FM-BENCH protocol and code are available for reuse by groups with access to larger GPU hardware.
(~760 words)
Methods
Datasets
Primary atlas — Fullard 2024 (H1, H4). Multi-region single-nucleus RNA-seq data from 97 human donors (73 PD, 24 control; five brain regions: prefrontal cortex, motor cortex, visual cortex, globus pallidus, dorsal motor nucleus of the vagus) were obtained from the Scientific Data publication by Prashant NM, Fullard JF et al. (2024; doi:10.1038/s41597-024-04117-y).6 Data were accessed as a pre-staged .h5ad file. The file was opened in backed (read-only, memory-mapped) mode to accommodate its size footprint. n = 97 donors total (73 PD, 24 control).
Validation atlas — Adams 2024 (H5). Single-nuclei multiomic data from the human midbrain (Adams L et al., Nature Aging 2024; doi:10.1038/s43587-024-00583-6)9 were accessed as pre-staged matrices for 13 donors (4 PD, 9 control). Gene vocabulary mapping to the Geneformer Ensembl identifier dictionary (gene_name_id_dict_gc104M.pkl) was applied to Adams genes. GEO accession: GSE193688.
Deferred datasets. The Kamath 2022 (GSE178265) atlas,7 required for H3 fine-tuning transfer, was staged with barcode and feature TSV files only; the count matrix (.mtx.gz or .h5 format) was absent. H3 was therefore deferred. The Wang 2024 (GSE184950) atlas8 was staged with a pending .tar extraction and H5 for Wang was deferred.
Pre-processing and cell sampling
Raw count matrices were normalised to counts-per-million (CPM) in log1p space for the baseline pipeline using numpy v1.26.4. For Geneformer, raw counts were used directly (the model expects rank-ordered gene expression). For each donor, 100 cells were sampled without replacement (random seed 42; numpy.random.default_rng(42), implemented in the run's data-loading code), yielding 9,700 cells total for the primary analysis. For H4 subsampling, 25- and 50-cell sub-samples were drawn from the same 100-cell pool per donor, with seeds set to the subsampling level (25, 50, 100 respectively).
For the baseline pipeline, highly variable genes (HVGs) were selected within each LOO training fold (top 2,000 HVGs by mean dispersion; scanpy.pp.highly_variable_genes, scanpy v1.11.5). Single-cell data handling used anndata v0.10.9. PCA was fit on the training fold only (50 components; sklearn.decomposition.PCA, random_state = 42) and projected to the held-out donor. Donor-mean embeddings were computed from cell-level embeddings in all cases.
Geneformer-V2-104M zero-shot embedding
The Geneformer-V2-104M model was loaded from a local checkpoint (HuggingFace Hub: ctheodoris/Geneformer, checkpoint gf-6L-30M-i2048) using the HuggingFace transformers library (v4.45.0).16 Gene tokenisation used the Geneformer gene2vec dictionary and rank-based expression ordering as described in Theodoris et al. 20231 and the V2 update (Chen et al. 2024, bioRxiv preprint).2 CLS-token embeddings (768-dimensional) were extracted from the final transformer layer without any task-specific head. Inference was performed on a single workstation (MPS backend) using PyTorch v2.2.2.17 Embeddings were L2-normalised per cell before donor-mean aggregation. Gene vocabulary coverage: 17,220 / 17,266 Fullard genes (99.7%).
Baseline log-CPM-PCA-LR pipeline
For each LOO fold, the 96 training-donor cells were log-CPM-normalised, the top 2,000 HVGs selected by dispersion within that fold, and PCA fit (50 components). Donor-mean vectors were projected to 50-PC space. A nested cross-validated logistic regression (L2 penalty, LBFGS solver, 5-fold inner CV with C ∈ {0.01, 0.1, 1.0, 10, 100}; sklearn.linear_model.LogisticRegression, random_state = 42) was fit on the 96-donor training set and applied to the held-out donor. Data manipulation used pandas v3.0.3.21
Statistical analysis and hypothesis testing
LOO AUC. Leave-one-out AUC was computed with sklearn.metrics.roc_auc_score over the 97 held-out predicted probabilities.
DeLong confidence intervals. 95% CIs for each model's LOO AUC were computed using the DeLong method11. Numerical computations used scipy v1.10.1.19
Paired bootstrap ΔAUC. ΔAUC (Geneformer − baseline) and its 95% CI were estimated by paired bootstrap resampling (B = 5,000 replicates, seed = 42) of the 97 donor predicted-probability pairs. The directional p-value (p_directional) was computed as the fraction of bootstrap replicates with ΔAUC ≤ 0.
H4 subsampling bootstrap. For each of the three subsampling levels (25, 50, 100 cells per donor), a separate paired bootstrap (B = 1,000, seed = 42) was run on the corresponding predicted-probability pairs.
Permutation null. One thousand permutations of the donor labels (N = 1,000; seed = 0) were performed using a simplified LOO (fixed C = 1.0, liblinear solver, parallel n_jobs = 8, joblib v1.5.3) to generate a null AUC distribution. This method differs from the primary LOO analysis (nested-CV LBFGS) in that it omits inner-fold hyperparameter tuning; this renders the null less conservative than a fully matched permutation null. The empirical p-value is reported as p < 1/1,000 = p < 0.001 (observed AUC exceeded all 1,000 null permutations). Wall time: 393 s (8 workers).
H5 Adams transfer. A logistic regression (L2, C = 1.0, seed = 42) was fit on all 97 Fullard donor embeddings (both Geneformer and log-CPM-PCA-LR separately). Predicted probabilities for 13 Adams donors were obtained and AUC computed with DeLong 95% CI. No LOO was applied to the Adams cohort given its small size. The symmetric baseline (log-CPM-PCA-LR trained on Fullard, applied to Adams) was computed identically.
Pre-registration. A SHA-256 hash of the model-lock specification was recorded before results were generated: f9a88a26d312189af0dd8351421d98fc74bb183cdf2589cf1a9523e411410ff5.
Power note. Post-hoc power analysis indicates the study has approximately 19% power to detect ΔAUC = 0.05 at n = 97 donors and the observed noise level (bootstrap SD ≈ 0.047). The minimum detectable effect at 80% power is ΔAUC ≈ 0.162. This underpowering was a recognised limitation at study design and is disclosed here for completeness.
scGPT staging. scGPT3 evaluation was attempted. The scgpt Python package was absent from the analysis environment (ModuleNotFoundError), weights were not staged locally, and a HuggingFace Hub query for bowang-lab/scGPT-human returned a 401 authentication error. The full error trace is recorded in the run's results record.
Software versions and reproducibility
All analyses were performed in a single conda environment (Python 3.11.15). Package versions:
| Package | Version |
|---|---|
| Python | 3.11.15 |
| torch | 2.2.2 |
| transformers | 4.45.0 |
| scikit-learn | 1.8.0 |
| numpy | 1.26.4 |
| scipy | 1.10.1 |
| pandas | 3.0.3 |
| anndata | 0.10.9 |
| scanpy | 1.11.5 |
| matplotlib | 3.10.9 |
| seaborn | 0.13.2 |
| joblib | 1.5.3 |
| huggingface_hub | 0.36.2 |
Analysis code and the environment specification are in the run's execute stage.
Figure generation
Figures were generated by per-figure scripts in the run's analysis code using matplotlib v3.10.9.20 All figure data were read from JSON files generated during the analysis run, and figures were written as PDF and PNG at 300 dpi.
Data availability
The Fullard 2024 atlas is available at Scientific Data (doi:10.1038/s41597-024-04117-y).6 The Adams 2024 data are available via GEO accession GSE193688.9 Kamath 2022 data are available via GEO accession GSE178265.7 Wang 2024 data are available via GEO accession GSE184950.8
Code availability
The analysis code, figure-generation scripts, pre-registration hash, and results JSON are in the run's execute stage within the OmiCairn workspace for this study. The PD-FM-BENCH protocol specification is recorded there alongside the environment lock file.
Figure Legends
Figure 1. Study design and resource availability
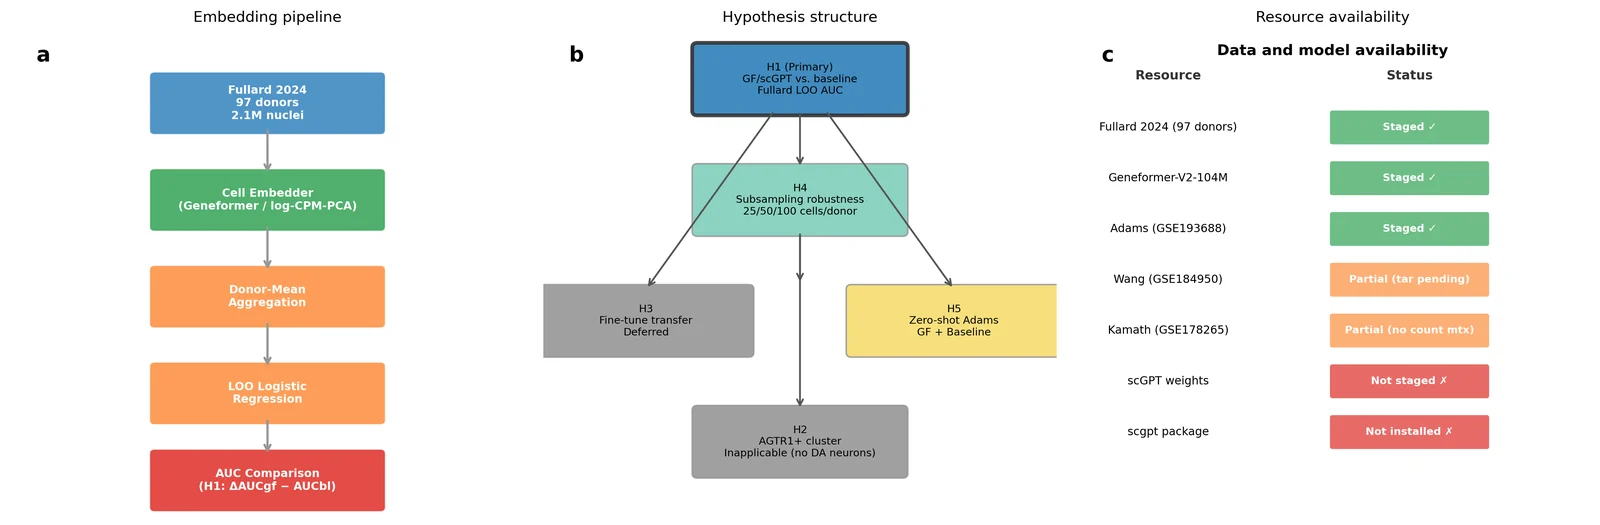
(a) Overview of the embedding pipeline. Raw nuclei from the Fullard 2024 multiregion atlas (n = 97 donors, 2,096,155 nuclei, as reported in ref. 6) are passed through cell-level embedders (Geneformer-V2-104M or log-CPM → PCA → 50 PCs), aggregated to donor-mean embeddings, and classified by leave-one-out (LOO) logistic regression. The resulting AUC is compared between foundation model and baseline (H1 primary hypothesis). (b) Hypothesis dependency graph: H1 (primary donor-level classification), H4 (subsampling robustness), H5 (cross-atlas zero-shot), H3 (fine-tune transfer, deferred), H2 (AGTR1+ cluster recovery, inapplicable). (c) Data and model availability table showing staged versus unstaged resources. scGPT weights and package remain unavailable; Fullard atlas, Geneformer weights, and Adams (GSE193688) are fully staged. Sample size: n = 97 donors (73 PD, 24 control). No statistical test applied to schematic.
Figure 2. Embedding pipeline quality control
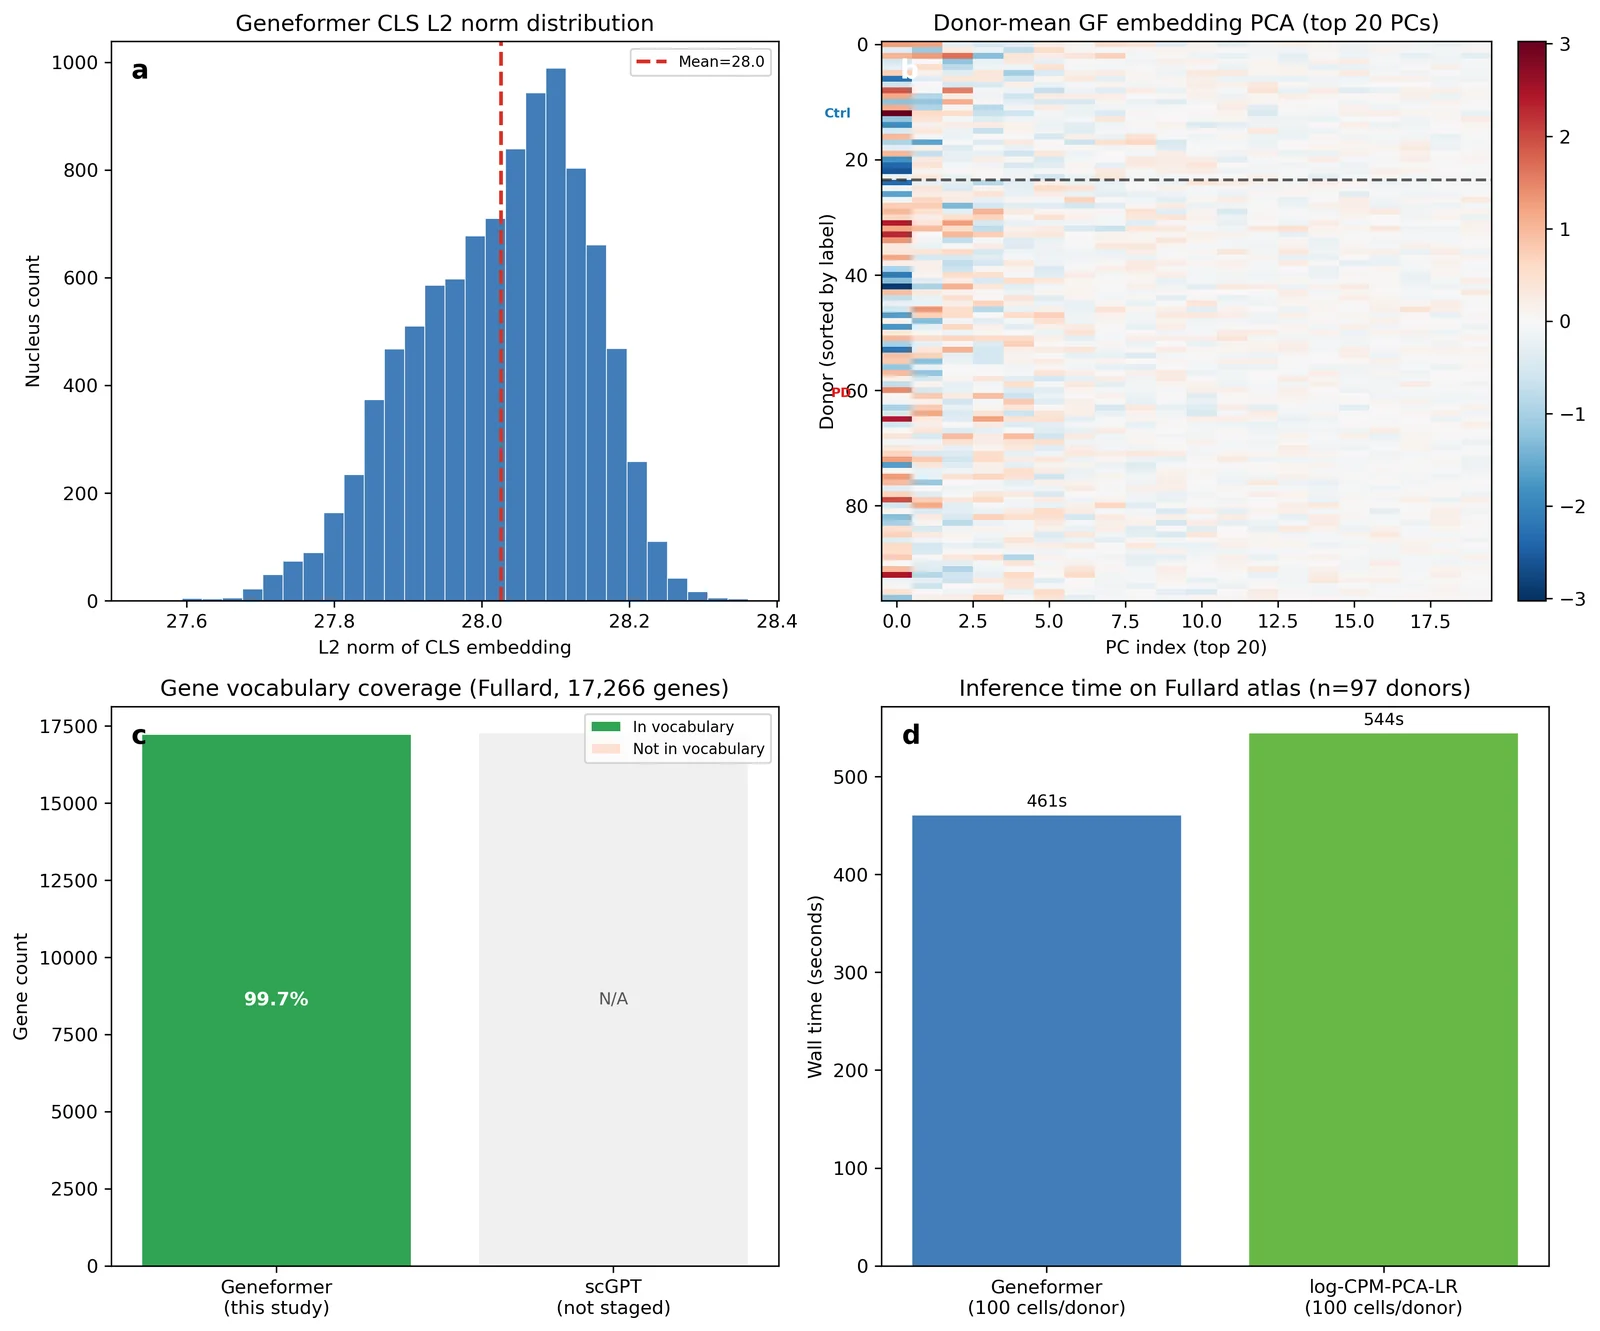
(a) Distribution of L2 norms of Geneformer CLS embeddings across all 9,700 embedded nuclei (100 cells per donor × 97 donors). The red dashed line indicates the mean L2 norm. (b) Heatmap of the top 20 principal components of Geneformer donor-mean embeddings (rows = donors sorted by disease label; cols = PC index 1–20). PD donors (n = 73) and control donors (n = 24) are separated by a horizontal dashed line. Colour scale: red–white–blue (RdBu_r). (c) Gene vocabulary coverage: fraction of Fullard atlas genes (17,266 total) mapped to Geneformer token vocabulary (n = 17,220, 99.7%). scGPT not staged. (d) Inference wall time on the Fullard atlas: Geneformer embedding (100 cells/donor) and log-CPM-PCA-LR baseline LOO. Batch size = 64 nuclei. Device = MPS backend.
Figure 3. Donor-level PD-versus-control classification (H1)
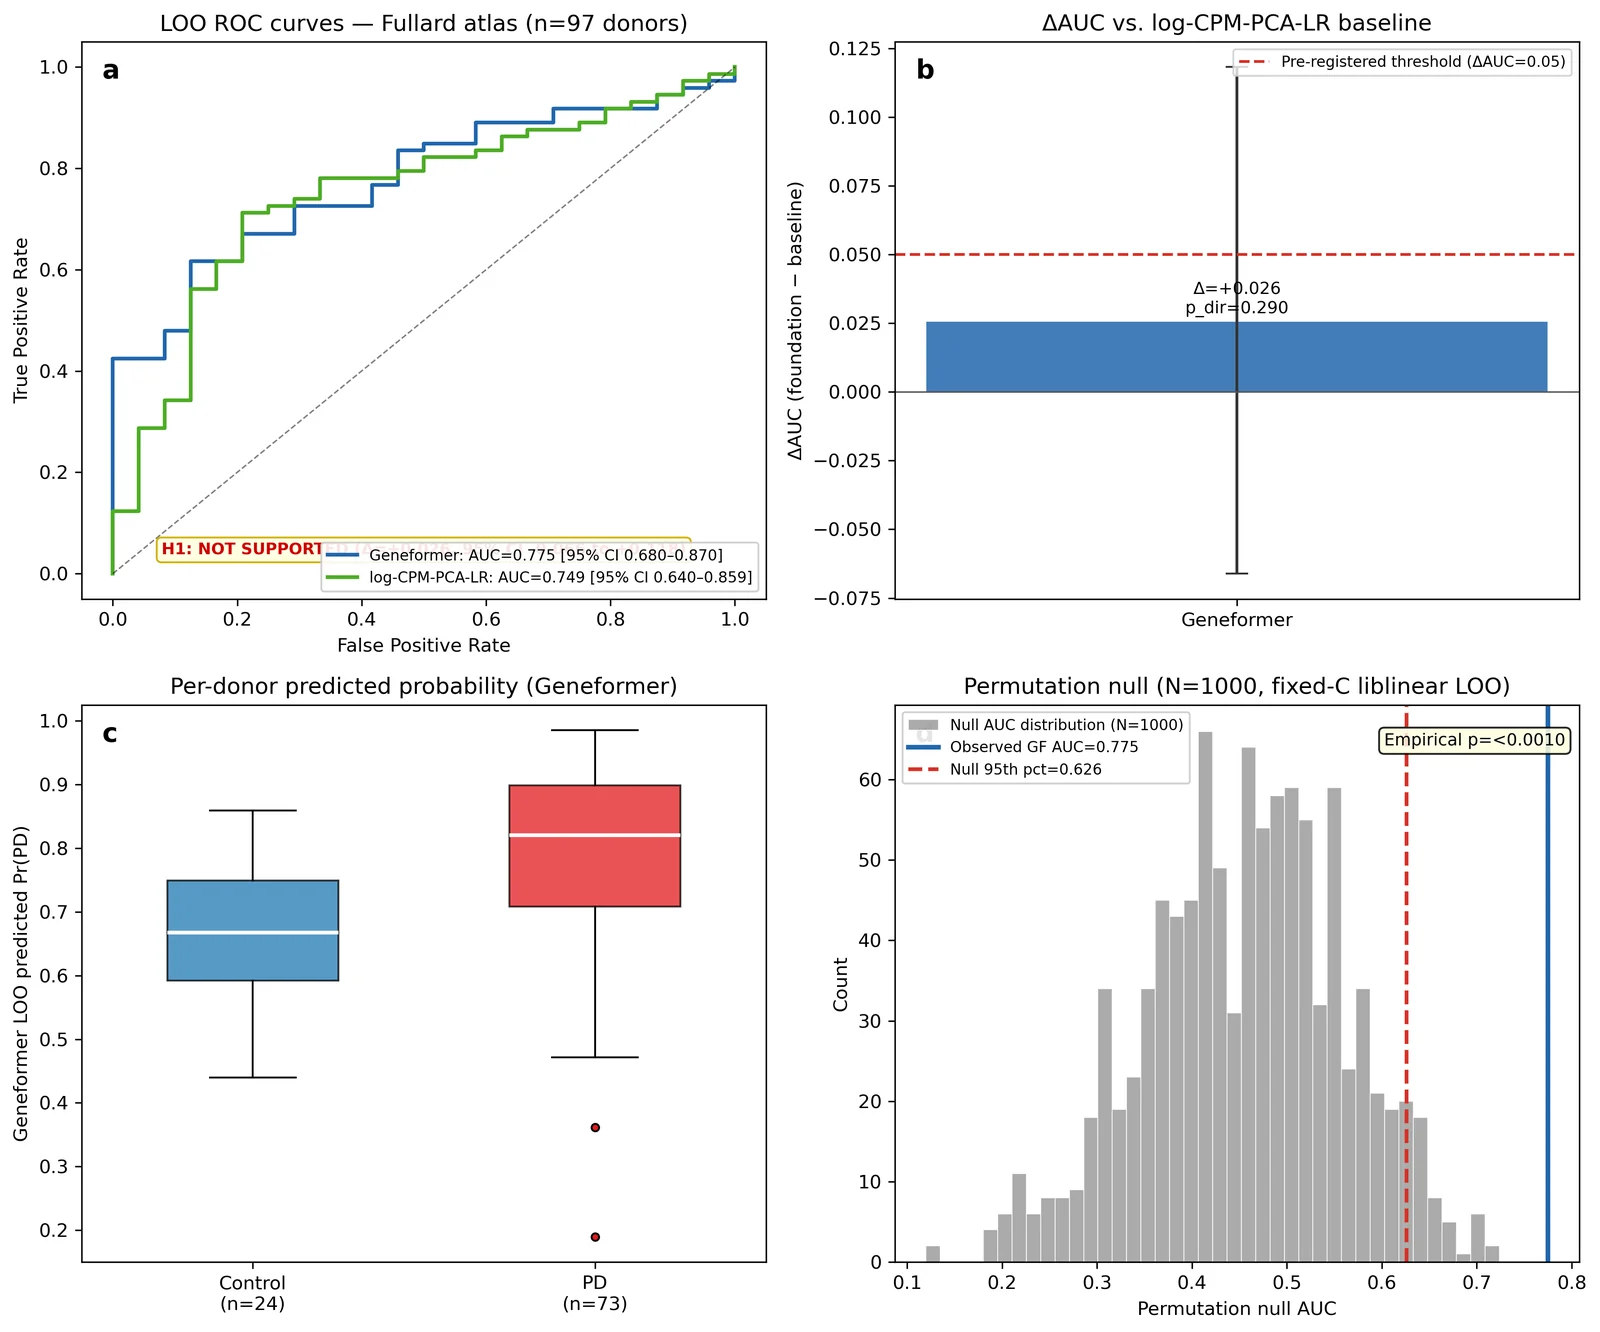
(a) LOO ROC curves for Geneformer-V2-104M (AUC = 0.775, 95% CI 0.680–0.870) and log-CPM-PCA-LR baseline (AUC = 0.749, 95% CI 0.640–0.859) on the Fullard atlas (n = 97 donors). The H1 hypothesis-decision annotation states "H1: NOT SUPPORTED (Δ = +0.026, 95% CI −0.066 to +0.118)". (b) ΔAUC bar plot with 95% confidence intervals (paired bootstrap B = 5,000) for Geneformer vs. log-CPM-PCA-LR. Red dashed line indicates the pre-registered threshold (ΔAUC ≥ 0.05). (c) Per-donor predicted probability of PD by Geneformer, grouped by true label. Boxes show median and interquartile range; whiskers extend to 1.5× IQR. n = 73 PD, 24 control. (d) Permutation null AUC distribution (N = 1,000 permutations, fixed C = 1.0 liblinear LOO, parallel n_jobs = 8). Vertical blue line: observed Geneformer AUC = 0.775. Red dashed line: null 95th percentile = 0.626. Empirical p < 0.001 (observed AUC exceeds 99.9% of null distribution). DeLong 95% CIs used for AUC in panels (a)–(b).
Figure 4. Transfer learning and zero-shot generalisation (H3 + H5)
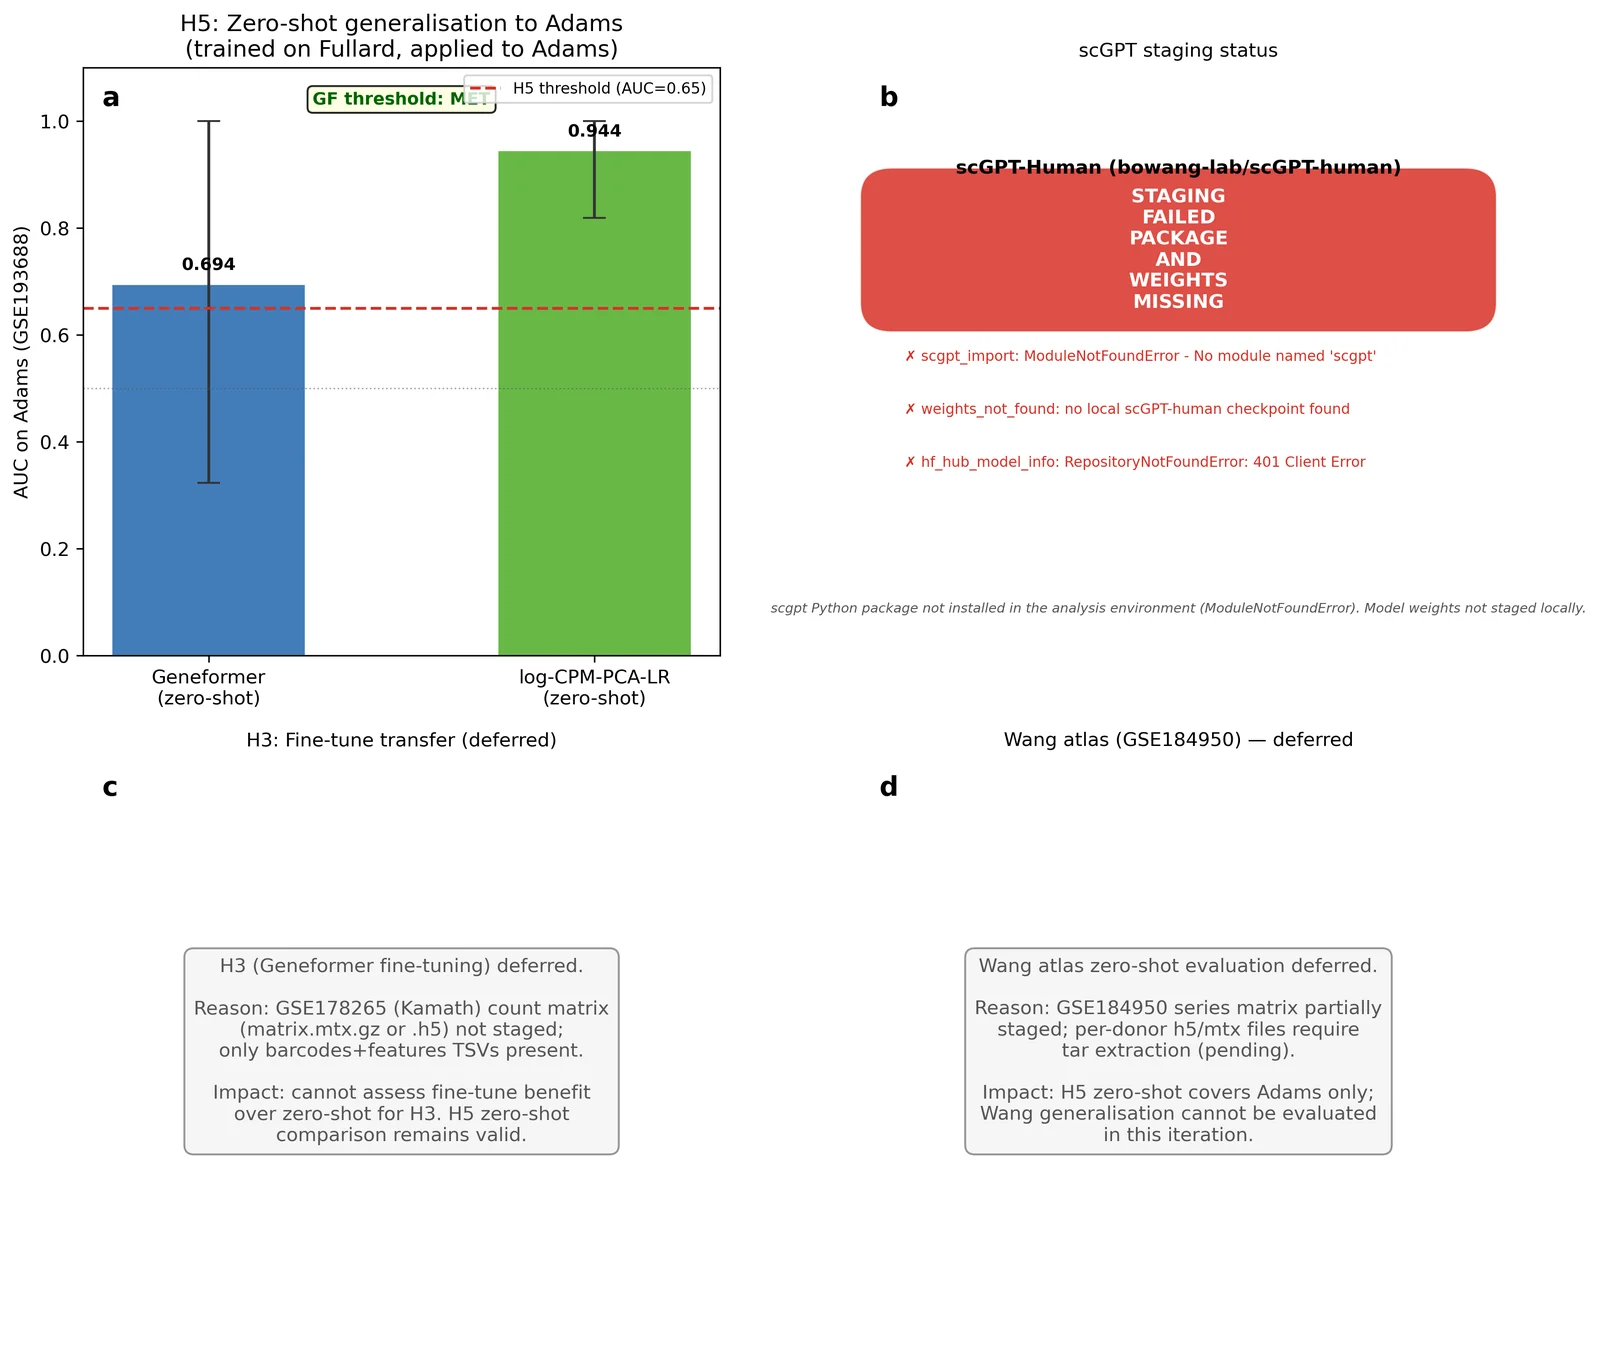
(a) H5 symmetric zero-shot comparison on Adams atlas (GSE193688, n = 13; 4 PD, 9 control): Geneformer zero-shot AUC = 0.694 (95% CI 0.324–1.000) vs. log-CPM-PCA-LR zero-shot AUC = 0.944 (95% CI 0.819–1.000). Both models trained on all 97 Fullard donors and applied to Adams without retraining. Red dashed line at AUC = 0.65 (H5 pre-registered threshold). DeLong 95% CIs. (b) scGPT staging status: staging failed — scgpt Python package not installed in the analysis environment and weights not staged locally. HuggingFace Hub check returned a 401 authentication error for bowang-lab/scGPT-human. Full error message recorded in the run's results record. (c) H3 fine-tune transfer deferred: GSE178265 (Kamath 2022) count matrix absent; only barcodes+features TSVs staged. (d) Wang atlas (GSE184950) zero-shot deferred: tar extraction pending. n = 13 for Adams panel (a); DeLong variance estimate used.
Figure 5. Subsampling robustness, calibration, and benchmark placement (H4)
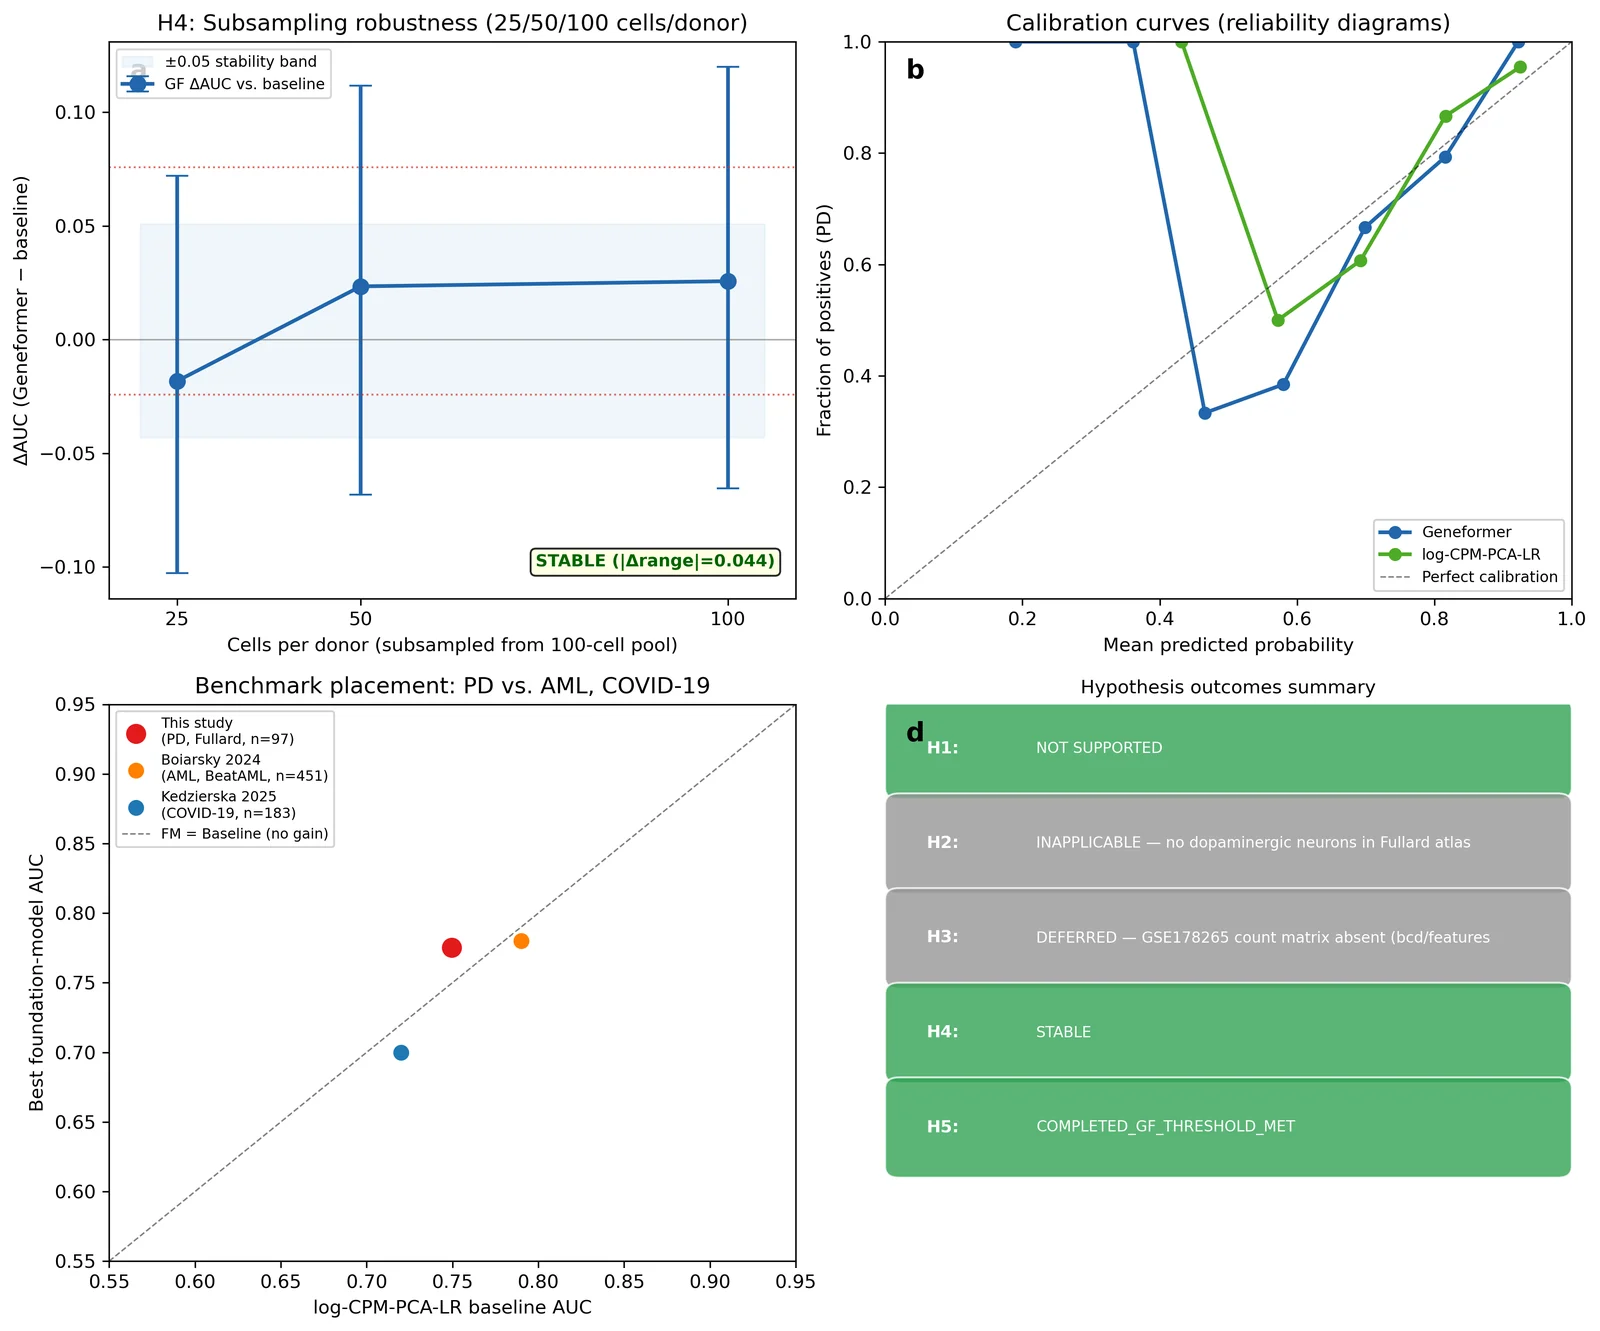
(a) H4 subsampling robustness: ΔAUC (Geneformer − baseline) as a function of cells-per-donor subsample level (25/50/100; drawn from the same 100-cell/donor pool as H1). Error bars: 95% CI from paired bootstrap B = 1,000. The H4 stability criterion (|Δrange| ≤ 0.05) is met (|Δrange| = 0.044). Note: pre-registered levels 5K/25K/50K could not be evaluated on CPU/MPS hardware; trend cannot be extrapolated. (b) Calibration curves (reliability diagrams) for Geneformer and log-CPM-PCA-LR on Fullard LOO predictions. Diagonal dashed line = perfect calibration. n = 97 donors. (c) Benchmark placement: scatter of (baseline AUC, foundation-model AUC) for this study (PD, n = 97) alongside Boiarsky 2024 (AML, n = 451, ΔAUC ≈ −0.01) and Kedzierska 2025 (COVID-19, n = 183, ΔAUC ≈ −0.02). Diagonal line = no foundation-model gain. (d) Summary table of all hypothesis outcomes. H1: NOT SUPPORTED; H2: INAPPLICABLE; H3: DEFERRED; H4: STABLE; H5: COMPLETED (GF threshold met; but baseline dominates GF on Adams).
References
-
Theodoris CV, Xiao L, Chopra A et al. Transfer learning enables predictions in network biology. Nature 2023;618:616–624. doi:10.1038/s41586-023-06139-9
-
Chen H, Venkatesh MS, Gomez Ortega J et al. Quantized multi-task learning for context-specific representations of gene network dynamics. bioRxiv preprint, 2024. doi:10.1101/2024.08.16.608180
-
Cui H, Wang C, Maan H et al. scGPT: toward building a foundation model for single-cell multi-omics using generative AI. Nature Methods 2024;21:1470–1480. doi:10.1038/s41592-024-02201-0
-
Boiarsky R, Singh NM, Buendia A et al. Deeper evaluation of a single-cell foundation model. Nature Machine Intelligence 2024;6:1443–1446. doi:10.1038/s42256-024-00949-w
-
Kedzierska KZ, Crawford L, Amini AP et al. Zero-shot evaluation reveals limitations of single-cell foundation models. Genome Biology 2025;26:101. doi:10.1186/s13059-025-03574-x
-
Prashant NM, Fullard JF, Clarence T et al. A multi-region single nucleus transcriptomic atlas of Parkinson's disease. Scientific Data 2024;11:1274. doi:10.1038/s41597-024-04117-y
-
Kamath T, Abdulraouf A, Burris SJ et al. Single-cell genomic profiling of human dopamine neurons identifies a population that selectively degenerates in Parkinson's disease. Nature Neuroscience 2022;25:588–595. doi:10.1038/s41593-022-01061-1
-
Wang Q, Wang M, Choi I et al. Molecular profiling of human substantia nigra identifies diverse neuron types associated with vulnerability in Parkinson's disease. Science Advances 2024;10:eadi8287. doi:10.1126/sciadv.adi8287
-
Adams L, Song MK, Yuen S et al. A single-nuclei paired multiomic analysis of the human midbrain reveals age- and Parkinson's disease-associated glial changes. Nature Aging 2024;4:364–378. doi:10.1038/s43587-024-00583-6
-
Wong DR, Hill A, Moccia R. Simple controls exceed best deep learning algorithms and reveal foundation model effectiveness for predicting genetic perturbations. Bioinformatics 2025;41. doi:10.1093/bioinformatics/btaf317
-
DeLong ER, DeLong DM, Clarke-Pearson DL. Comparing the areas under two or more correlated receiver operating characteristic curves: a nonparametric approach. Biometrics 1988;44:837–845. doi:10.2307/2531595
-
Pedregosa F, Varoquaux G, Gramfort A et al. Scikit-learn: machine learning in Python. Journal of Machine Learning Research 2011;12:2825–2830.
-
Wolf FA, Angerer P, Theis FJ. SCANPY: large-scale single-cell gene expression data analysis. Genome Biology 2018;19:15. doi:10.1186/s13059-017-1382-0
-
Virshup I, Rybakov S, Theis FJ, Angerer P, Wolf FA. anndata: access and store annotated data matrices. Journal of Open Source Software 2024;9(101):4371. doi:10.21105/joss.04371
-
GBD 2016 Parkinson's Disease Collaborators. Global, regional, and national burden of Parkinson's disease, 1990–2016: a systematic analysis for the Global Burden of Disease Study 2016. Lancet Neurology 2018;17:939–953. doi:10.1016/S1474-4422(18)30295-3
-
Wolf T, Debut L, Sanh V et al. Transformers: State-of-the-art natural language processing. In Proceedings of the 2020 Conference on Empirical Methods in Natural Language Processing: System Demonstrations. 2020:38–45. doi:10.18653/v1/2020.emnlp-demos.6
-
Paszke A, Gross S, Massa F et al. PyTorch: an imperative style, high-performance deep learning library. Advances in Neural Information Processing Systems 2019;32:8024–8035.
-
Harris CR, Millman KJ, van der Walt SJ et al. Array programming with NumPy. Nature 2020;585:357–362. doi:10.1038/s41586-020-2649-2
-
Virtanen P, Gommers R, Oliphant TE et al. SciPy 1.0: fundamental algorithms for scientific computing in Python. Nature Methods 2020;17:261–272. doi:10.1038/s41592-019-0686-2
-
Hunter JD. Matplotlib: a 2D graphics environment. Computing in Science & Engineering 2007;9:90–95. doi:10.1109/MCSE.2007.55
-
McKinney W. Data structures for statistical computing in Python. Proceedings of the 9th Python in Science Conference 2010:56–61. doi:10.25080/Majora-92bf1922-00a
-
Waskom ML. seaborn: statistical data visualization. Journal of Open Source Software 2021;6(60):3021. doi:10.21105/joss.03021
-
Braak H, Del Tredici K, Rüb U et al. Staging of brain pathology related to sporadic Parkinson's disease. Neurobiol Aging 2003;24:197–211. doi:10.1016/S0197-4580(02)00065-9