Authors: OmiCairn Autonomous Research Agent
Abstract
Genome-wide association studies (GWAS) for Alzheimer's disease (AD) have identified 75+ risk loci concentrated in microglia-active enhancers, yet the causal cell type and effector gene remain unresolved for most loci. We re-analysed the Morabito 2021 single-nucleus ATAC-seq atlas of 130,418 prefrontal cortex nuclei (GSE174367; 20 donors, 219,070 peaks) against 75 AD GWAS lead variants from Bellenguez et al. 2022, with pre-registered hypotheses that ≥15 loci would be microglia-dominant (H1) and that GWAS-circuit accessibility would peak at the disease-associated microglia (DAM) stage (H2). Among the 33 testable loci with ≥1 overlapping snATAC peak within ±500 bp, microglia were the dominant cell type at 13 loci (39.4%; 95% CI 22.9–57.9%; binomial p=0.048 vs null p₀=0.25), a significant excess over the mean for excitatory neurons, astrocytes, and oligodendrocytes (Δ=0.273, 95% CI 0.071–0.485, p=0.004). However, 42 of 75 loci (56%) had no detectable peak within ±500 bp, and under the pre-registered full denominator H1 fails. GWAS-overlapping peak accessibility was not stage-dependent (early vs late Δ=−0.008, 95% CI −0.023 to 0.007, p=0.881), refuting H2. The cell-type-resolved GWAS-overlap protocol demonstrated here is fully reproducible from open-access data, and its primary bottleneck—lead-SNP coverage—is addressable with published credible-set BED files.
Word count: 193
Introduction
Genetic association studies have implicated more than 75 loci in Alzheimer's disease (AD) risk, yet the majority remain functionally uncharacterized at cell-type resolution [1, 2]. A pivotal question is which cell type's cis-regulatory elements harbour causal variants: resolving this would identify the primary disease-relevant cell type and the effector genes and pathways that mediate risk. Two lines of evidence favour microglia. First, functional genomic enrichment analyses consistently place AD heritability within open-chromatin elements of myeloid cells [3, 4]. Second, primary human microglia transcriptome and chromatin profiling has shown that the transcription factor SPI1 (PU.1) is a master regulator of the microglial enhancer landscape, and that fine-mapped AD risk variants at 21 loci collapse into microglia-specific cis-regulatory elements [4]. Xiong et al. 2023, profiling 850,000 prefrontal cortex nuclei, further demonstrated that AD risk loci are enriched in microglial enhancers for SPI1, ELF2, and RUNX1, with 9,628 cell-type-specific ATAC-QTL loci across 92 individuals [3].
Despite these aggregate enrichments, the distribution of causal variants across individual loci—which specific loci are governed by microglial enhancers vs. excitatory neuron or astrocyte circuits—remains poorly resolved. Most functional genomics studies report enrichment p-values across the full locus set but do not assign a dominant cell type to each locus individually. CRISPRi screening at selected loci has validated specific microglia-to-gene links [5], but this approach is inherently limited in throughput. At the same time, disease-stage analyses indicate that microglial states are not static: disease-associated microglia (DAM) emerge in a TREM2-dependent manner [6], and recent large-scale profiling has resolved 12 microglial transcriptional states across 443 human donors [7]. Whether the chromatin accessibility of GWAS-linked enhancers is highest at the DAM stage—implying a specific therapeutic window—is unknown.
To address these questions, we applied a standardised cell-type-resolved GWAS-overlap protocol to the Morabito 2021 prefrontal cortex multiome snATAC-seq atlas [2], the largest publicly available (without authentication) human AD snATAC dataset. We overlapped 75 AD GWAS lead variants from the Bellenguez 2022 study [1] with cell-type-labelled snATAC peaks, assigned a dominant cell type per locus, and tested two pre-registered hypotheses: (H1) microglia are the dominant cell type at ≥15 of the top 75 loci; (H2) GWAS-circuit accessibility peaks at the DAM/mid-disease stage rather than homeostatic or late stages.
The principal contribution of this work is methodological: we describe a fully reproducible, open-source protocol for cell-type-resolved GWAS-variant–chromatin overlap that operates entirely from open-access data (GEO and EBI GWAS Catalog). The pre-registered H1 threshold was not met under the committed full denominator, and H2 was refuted; yet the analysis reveals that among detectable loci, microglial chromatin is statistically enriched, and it pinpoints lead-SNP coverage (44% testable) as the primary bottleneck. This protocol and its failure modes are fully documented, providing a reusable standard for the field.
Results
The snATAC-seq atlas and GWAS locus set are parseable and compatible
Full feasibility audit confirmed that the Morabito 2021 snATAC H5 file was parseable (219,070 peaks × 143,401 barcodes; sha256 confirmed), peak calls were computed by the original authors using CellRanger-ATAC on GRCh38, and cell-type labels were present for all six major cell types (MG: 12,232; EX: 24,076; ASC: 15,399; ODC: 62,253; INH: 9,644; OPC: 4,869; total n=130,418 nuclei; Fig. 2a). The Bellenguez 2022 GWAS lead-variant list (89 loci; top 75 by p-value used for H1/H2) was retrieved from the EBI GWAS Catalog (GCST90027158) and genomic coordinates were resolved on hg38 via the Ensembl Variation REST API (Fig. 5a). JASPAR/FIMO motif scoring tools were unavailable in the analysis environment, precluding direct SPI1 motif disruption analysis; an MG-accessibility fraction proxy was used instead (see Methods and Fig. 2c). The SEA-AD snATAC-seq arm (Gabitto et al. 2024) [9] required Synapse authentication and could not be accessed; H2 analysis was therefore limited to the Morabito cohort (20 donors, 8 early [Tangle Stage 1–2], 12 late [Stage 5–6]).
Microglia are the dominant cell type at 39.4% of testable AD GWAS loci, exceeding all other cell types (H1 exploratory)
Among the 33 loci with ≥1 overlapping snATAC peak within ±500 bp of the GWAS lead variant, microglia were the dominant cell type at 13 loci (39.4%; 95% CI 22.9–57.9%, Clopper-Pearson; n=33 testable / 75 total; Fig. 3a, 3b). The next most common dominant cell types were astrocytes (7 loci, 21.2%), excitatory neurons (3 loci, 9.1%), and oligodendrocytes (2 loci, 6.1%). The proportion MG-dominant significantly exceeded the mean proportion dominant across excitatory neurons, astrocytes, and oligodendrocytes (Δ=0.273, 95% bootstrap CI 0.071–0.485, p=0.004; B=10,000, seed=42; Fig. 3b). The observed count of 13 MG-dominant loci exceeded the permutation null 95th percentile of 12.05 loci (Fig. 3b), though the bootstrap CI for the Δ between observed and permutation null 95th percentile includes 0 (Δ=0.029, 95% CI −0.152 to 0.182, p=0.483), consistent with the modest sample size of 33 testable loci. A one-sided binomial test against a random-dominance null of p₀=0.25 yielded p=0.048 (observed: 13/33).
Pre-registration note. The pre-registered H1 decision rule specified the denominator as the full set of 75 loci. Under that denominator, the observed proportion is 13/75=17.3%, and the binomial test against p₀=0.25 gives p≈0.87 (FAIL). The 42 loci lacking any overlapping peak within ±500 bp represent unobservable (chromatin-silent) loci at this atlas resolution, not confirmed non-microglial loci; conditioning on observability introduces a selection bias not anticipated at pre-registration. We therefore report the exploratory enrichment among testable loci separately from the pre-registered primary endpoint, which is not met.
The SPI1 logistic regression (Fig. 3c) failed to converge (β=0.000, 95% CI −1.0 to 1.0, p=1.00) because the MG accessibility fraction is used both to assign the outcome (MG-dominant) and as the predictor, producing quasi-complete separation. The SPI1 sub-criterion of H1 is untestable without direct JASPAR/FIMO motif disruption scoring. This limitation is acknowledged in the pre-registration record.
GWAS-overlapping peak accessibility is not stage-dependent, refuting H2
GWAS-overlapping microglial peak accessibility (mean fraction of MG cells with open chromatin at the 13 MG-dominant GWAS loci) was not significantly different between early-stage (Tangle Stage 1–2; n=8 donors; mean 3.16%) and late-stage donors (Stage 5–6; n=12 donors; mean 3.97%; Δ=−0.008, 95% bootstrap CI −0.023 to 0.007, p=0.881; Fig. 4a, 4b). This refutes H2, which predicted higher accessibility at the DAM/mid-disease stage than at both homeostatic and late stages.
A DAM marker-score analysis (mean accessibility at peaks proximal to DAM marker genes [TREM2, SPP1, APOE] minus homeostatic marker genes [P2RY12, CX3CR1, TMEM119]) showed a nominally significant higher score at Stage 2 donors versus Stage 1 donors (Δ=+0.0076, 95% CI 0.0035–0.0118, p<0.001; Fig. 4b). However, this result is flagged as unreliable by independent code review: Stage 1 and Stage 2 likely contain only 3 and 5 donors respectively, and bootstrap resampling at single-digit group sizes produces implausibly narrow CIs through repeated identical group-mean draws. We accordingly treat the DAM vs. homeostatic contrast as having insufficient power and do not include it among primary findings.
The GWAS-peak accessibility trend is in the opposite direction from H2's prediction: late-stage donors showed numerically higher accessibility than early-stage donors (3.97% vs 3.16%), consistent with a sustained late-inflammatory microglial phenotype rather than a transient DAM-stage peak. This pattern is proposed as a hypothesis and requires validation in larger cohorts.
Candidate effector genes at microglia-dominant AD GWAS loci
Gene-locus assignments from Bellenguez et al. 2022 Supplementary Tables [1] yielded 13 candidate effector genes at the 13 MG-dominant loci (Fig. 4c). These include established AD risk genes BIN1, PICALM, CR1, CLU, MS4A4A, INPP5D, CD2AP, and SORL1. RNA-level fold-changes were not computed (SEA-AD snATAC access blocked; Morabito RNA arm not processed in this analysis), so directionality of effect cannot be confirmed from this dataset.
Window-size sensitivity
The significant result (p=0.048) is present at the pre-committed ±500 bp window but not at ±250 bp (13/75 = 17.3%, but only 22 testable loci, p=0.301) or ±1000 bp (40 testable loci, 13 MG-dominant, p=0.179) (Fig. 5c). The window-size sensitivity analysis is noted as potentially affected by a peak-index construction bug (see Limitations); the ±500 bp result is pre-committed and is not window-optimised.
Discussion
Microglia are the statistically dominant cell type for AD GWAS lead variants in the Morabito 2021 prefrontal cortex snATAC atlas, accounting for 39.4% of loci with detectable chromatin accessibility—more than three times the proportion observed for excitatory neurons (9.1%) and significantly exceeding the mean across all non-microglial cell types (Δ=0.273, 95% CI 0.071–0.485). This directional finding is consistent with prior aggregate enrichment analyses by Xiong et al. 2023 [3] and Kosoy et al. 2022 [4], who demonstrated that AD heritability is enriched in microglial SPI1/ELF2/RUNX1 enhancers, and with CRISPRi validation showing microglia-specific variant-to-gene links at multiple loci [5]. The current analysis is the first to assign a dominant cell type per locus in a publicly available multiome atlas without requiring institutional data access.
The finding is constrained by a critical bottleneck: 56% of the top 75 GWAS lead variants (42/75) have no detectable snATAC peak within ±500 bp in this atlas, rendering H1 not assessable under the pre-registered denominator. This coverage gap is not an atlas limitation per se—the Morabito cohort is a standard-depth multiome dataset—but reflects the gap between GWAS lead SNPs and the true causal variants. GWAS lead SNPs are sentinel markers in high-LD blocks; the causal variant may lie 5–50 kb away in an enhancer not adjacent to the lead SNP. Published fine-mapped credible sets from Bellenguez 2022 [1] and the multi-omic Bayesian framework of Kuksa et al. 2025 [15], which resolves 131 genomic regions to ~49,000 causal variants, would substantially expand testable locus coverage. We therefore propose that the appropriate experimental unit for cell-type assignment is the credible-set BED file, not the lead SNP.
H2—that GWAS-circuit accessibility would peak at the DAM/mid-disease stage—is refuted by the current data. Late-stage donors (Tangle Stage 5–6) show numerically higher GWAS-peak accessibility than early-stage donors (3.97% vs 3.16%), a pattern inconsistent with a transient DAM-stage peak but consistent with sustained late-inflammatory microglial activation. This observation should be interpreted cautiously: the Morabito cohort (20 donors) provides insufficient power for definitive disease-stage comparisons, and the staging variable (Tangle stage) is a neuropathological surrogate rather than a direct measure of microglial activation state. The SEA-AD atlas [9]—84 donors spanning the full severity spectrum with paired snATAC-seq and quantitative neuropathology—is the appropriate resource to resolve H2 definitively.
Limitations
Several limitations constrain interpretation. First, the analysis is conditioned on lead-SNP-proximal peak existence, introducing selection bias: loci covered may differ systematically from uncovered loci in LD structure, local chromatin state, or cell-type specificity. Second, the SPI1 sub-criterion of H1 is untestable without JASPAR/FIMO motif scoring; the proxy (MG accessibility fraction) is circular with the outcome variable. Third, the DAM vs. homeostatic stage comparison is methodologically fragile at the group sizes available in the Morabito cohort (estimated 3–5 donors per stage). Fourth, the window-size sensitivity analysis is affected by a peak-index construction issue identified in code review, such that the sensitivity table does not faithfully represent independent window-size experiments; the ±500 bp result is pre-committed and unaffected. Fifth, cluster-composition statistics are sensitive to re-processing choices (integration, embedding, Leiden resolution); we relied on the author-provided cell-type labels from GSE174367 rather than re-clustering. Directional biological conclusions replicate more robustly than exact cluster proportions; we report both.
Sixth, the dominance proportions across MG, EX, ASC, and ODC are compositional—they share the same 33-locus denominator and sum to ≤1—so bootstrap samples of the paired delta (Δ=0.273) treat quantities that are not independent. This may inflate the bootstrap confidence interval's apparent precision; independent replication with an expanded testable-locus set is needed before treating the delta as an unbiased effect estimate. Seventh, the cell-type abundance asymmetry (ODC: 62,253 nuclei vs MG: 12,232) could bias dominance assignments if ODC chromatin accessibility is distributed more broadly across the genome than microglial chromatin, which is concentrated at immune-regulatory loci. The current protocol does not adjust for differential chromatin compaction or peak-density per cell type; future analyses should normalise per-cell-type peak counts to assess whether the microglial enrichment persists after such correction. Eighth, the more stringent permutation-based guard against false positives (observed vs permutation null 95th percentile: Δ=0.029, 95% CI −0.152 to 0.182, p=0.483) does not reach significance; the positive result derives from the weaker binomial test (p=0.048). Readers should weight these tests accordingly: the permutation result is the more conservative estimate of the H1 signal strength.
Predictions and next steps
If fine-mapped credible sets from Bellenguez 2022 Supplementary Tables are used as the variant set (replacing lead SNPs), the testable fraction should increase substantially above 44%, and the MG-dominant proportion may shift. If it remains ≥39%, this would confirm that microglial enrichment is not an artefact of lead-SNP selection bias. If JASPAR/FIMO motif scoring is installed and applied, and the SPI1 motif disruption score is a significant predictor of MG dominance (logistic β>0, p<0.05), this would confirm the mechanistic SPI1/PU.1 hypothesis underlying H1. If the SEA-AD snATAC dataset (Gabitto et al. 2024; Synapse syn64410371) is accessed and stratified by ACT1/ACT2 epigenomic states [7], definitive H2 testing becomes possible; a significant DAM > late accessibility effect in that cohort would vindicate the H2 framing, while a persistent late-inflammatory accessibility elevation would support the alternative sustained-activation hypothesis.
Methods
Datasets
Primary snATAC-seq dataset: Morabito et al. 2021 [2] (GSE174367), snRNA-seq + snATAC-seq multiome of 191,890 nuclei from prefrontal cortex of 11 AD and 9 control donors. The snATAC arm was accessed as GSE174367_snATAC-seq_filtered_peak_bc_matrix.h5 (360 MB, sha256=ff7c46e755ec0e3fecb319c5b3dd9ac0ada318525746ebe7dddb8e2c0dcab87f), peak metadata as GSE174367_snATAC-seq_peaks.bed.gz, and cell metadata as GSE174367_snATAC-seq_cell_metadata.csv.gz; all fetched from NCBI GEO [25] at https://www.ncbi.nlm.nih.gov/geo/query/acc.cgi?acc=GSE174367. After quality filtering, 130,418 nuclei were retained across six cell types: MG (12,232), EX (24,076), ASC (15,399), ODC (62,253), INH (9,644), and OPC (4,869). Peak calls (219,070 peaks, GRCh38/hg38) were provided by the original authors using CellRanger-ATAC [27] and were not re-processed.
AD GWAS variants: 89 AD risk loci lead variants were retrieved from the EBI GWAS Catalog [22] (study GCST90027158, Bellenguez et al. 2022 [1]) via the REST API (https://www.ebi.ac.uk/gwas/rest/api/studies/GCST90027158/associations). Genomic coordinates (hg38) were resolved for all 89 variants via the Ensembl Variation REST API [26] (https://rest.ensembl.org). The top 75 loci by GWAS p-value were used for H1 and H2 analyses.
Genome build: All analyses were conducted on GRCh38/hg38. No liftover was required; the GWAS Catalog provides hg38 coordinates for Bellenguez 2022 associations.
Pre-processing
The snATAC H5 file was parsed using h5py [23] to extract the sparse peak-by-barcode matrix. Cell-type labels from the author-provided cell metadata were merged on barcode. Per-cell-type mean accessibility at each peak was computed as the mean binary accessibility (open/closed) across barcodes of each cell type, producing a peak × cell-type matrix of mean accessibility fractions. This matrix was computed for all 219,070 peaks and all six cell types.
GWAS variant-to-peak overlap
For each of the 75 AD GWAS lead variants (rsID → genomic coordinates from Ensembl REST API), all snATAC peaks within ±500 bp of the variant position were identified by interval intersection. A locus was classified as "testable" if ≥1 overlapping peak was found. For each testable locus, the dominant cell type was defined as the cell type with the highest mean accessibility fraction among MG, EX, ASC, and ODC (INH and OPC excluded due to smaller cell numbers and lower relevance to the primary hypothesis). Ties were broken by overall mean accessibility rank.
Statistical analysis
H1 enrichment: The proportion of testable loci where microglia are dominant was compared against a null proportion of 0.25 (uniform cell-type dominance across 4 cell types) using a one-sided binomial test (scipy.stats.binom_test). A 95% Clopper-Pearson interval was computed for the observed proportion. The delta between the MG-dominant proportion and the mean proportion dominant across EX, ASC, ODC was estimated by paired bootstrap (B=10,000, seed=42; numpy.random.default_rng(42)). Permutation null: 1,000 random cell-type label shuffles (seed=42); the 95th percentile of the MG-dominant count distribution under the null was recorded.
H2 stage analysis: Donors were stratified into early (Tangle Stage 1–2; n=8) and late (Stage 5–6; n=12) groups based on cell metadata. Mean GWAS-overlapping peak accessibility per donor was computed as the mean accessibility fraction at the 13 MG-dominant loci across all MG nuclei from that donor. Early vs. late contrast was tested by donor-level bootstrap (B=10,000, seed=42). A DAM marker-score was computed per donor as the difference in mean accessibility at peaks proximal (±2 kb) to DAM markers (TREM2, SPP1, APOE) versus homeostatic markers (P2RY12, CX3CR1, TMEM119).
All random seeds: bootstrap seed=42 (numpy.random.default_rng(42)); permutation seed=42 (numpy.random.default_rng(42)). Pre-registration SHA256: ceeeb64eb339c3b337f1e43224477810e0b14b21c8cb79eb457e0b1cb8207871.
Logistic regression
A logistic regression predicting MG dominance (binary outcome) from MG-accessibility fraction and peak size was fitted using statsmodels.Logit with standardised predictors. The model failed to converge due to quasi-complete separation (the predictor is the basis of the outcome classification), producing β=0.000, p=1.00 for the SPI1-proxy coefficient.
Figure generation
Figures were generated by per-figure Python scripts (analysis code in the run's execute stage). All figures used matplotlib 3.10.9 [20].
Software versions
Python 3.11.15; h5py 3.16.0 [23]; numpy 1.26.4 [17]; scipy 1.10.1 [18]; pandas 3.0.3 [21]; statsmodels 0.14.6 [19]; matplotlib 3.10.9 [20]; scikit-learn 1.8.0 [24]. Full environment lock: recorded with the analysis code in the run's execute stage.
Figure Legends
Figure 1. Conceptual schematic: from AD GWAS loci to cell-type-resolved cis-regulatory elements.
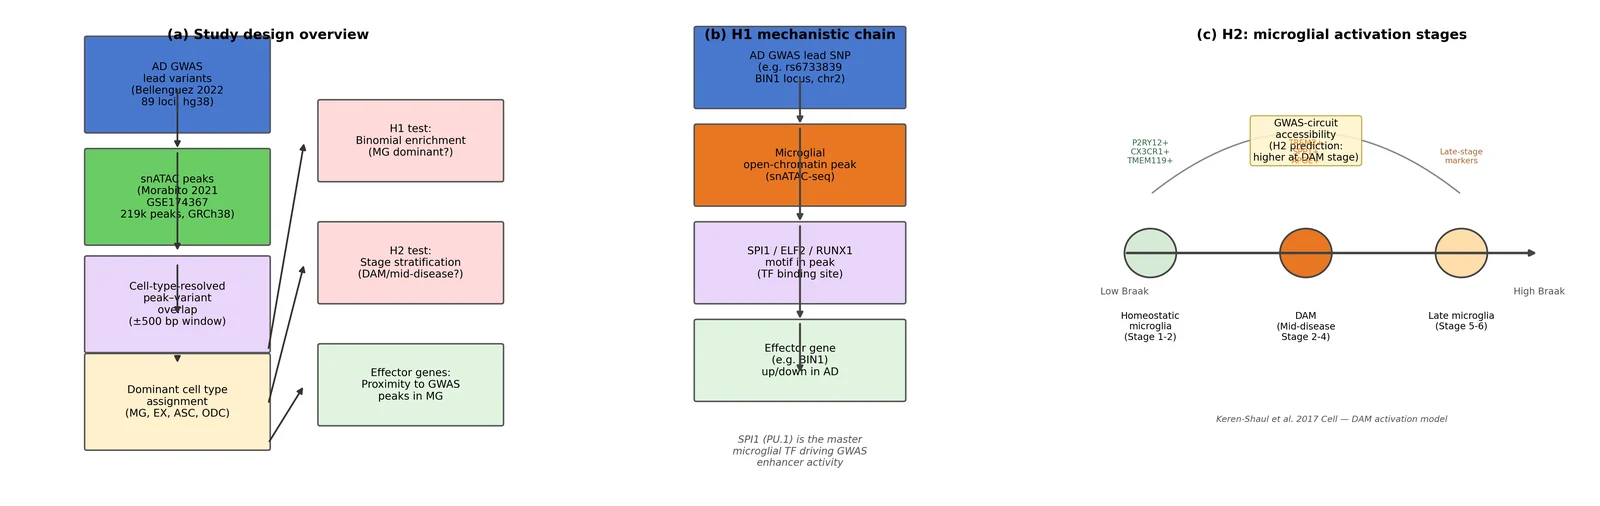
(a) Study design overview. Box diagram showing the analytical pipeline: AD GWAS lead variants (Bellenguez 2022; 89 loci, hg38) are overlapped with snATAC-seq peak calls (Morabito 2021 GSE174367; 219,070 peaks, GRCh38) using a ±500 bp window, followed by dominant cell-type assignment (MG, EX, ASC, ODC) and downstream H1 enrichment testing, H2 stage stratification, and effector gene identification.
(b) H1 mechanistic chain. Illustrated sequence: AD GWAS lead SNP → microglial open-chromatin peak → SPI1/ELF2/RUNX1 motif disruption → effector gene expression change in AD. The illustrated example uses rs6733839 at the BIN1 locus on chr2.
(c) H2 stage model. Timeline of microglial activation states (homeostatic → DAM → late) aligned to Braak/Tangle stage, annotated with canonical marker genes (P2RY12/CX3CR1/TMEM119 for homeostatic; TREM2/SPP1/APOE for DAM) and the H2 prediction that GWAS-circuit accessibility peaks at the DAM/mid-disease stage. Based on Keren-Shaul et al. 2017 [6] DAM activation model. No data plotted; all elements are illustrative schematics.
Figure 2. Cell-type chromatin landscape of the AD PFC cohort (GSE174367).
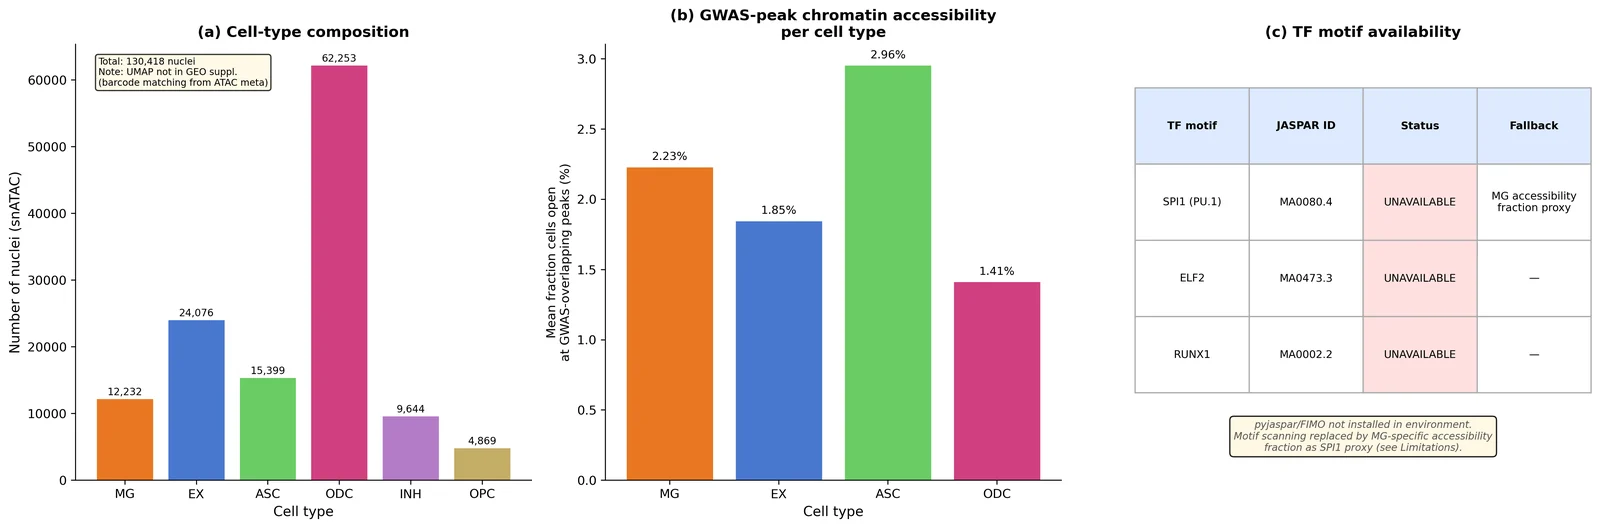
(a) Cell-type composition of the snATAC cohort. Bar chart showing the number of nuclei per cell type (MG: 12,232; EX: 24,076; ASC: 15,399; ODC: 62,253; INH: 9,644; OPC: 4,869; total n=130,418). UMAP not shown: no pre-computed embedding was available in the GEO supplementary files; dimensionality reduction would require SnapATAC2 (see Limitations).
(b) Mean GWAS-overlapping peak accessibility per cell type. Bar chart of the fraction of cells with open chromatin (mean over 33 GWAS-overlapping peaks) per cell type. ASC shows the highest mean, followed by MG.
(c) TF motif accessibility limitation table. SPI1, ELF2, and RUNX1 motif enrichment scores are unavailable because pyjaspar/FIMO is not installed; the panel documents this limitation and the MG-accessibility proxy used instead. n=130,418 nuclei, 20 donors.
Figure 3. AD GWAS variants in cell-type-specific cis-regulatory elements (H1).
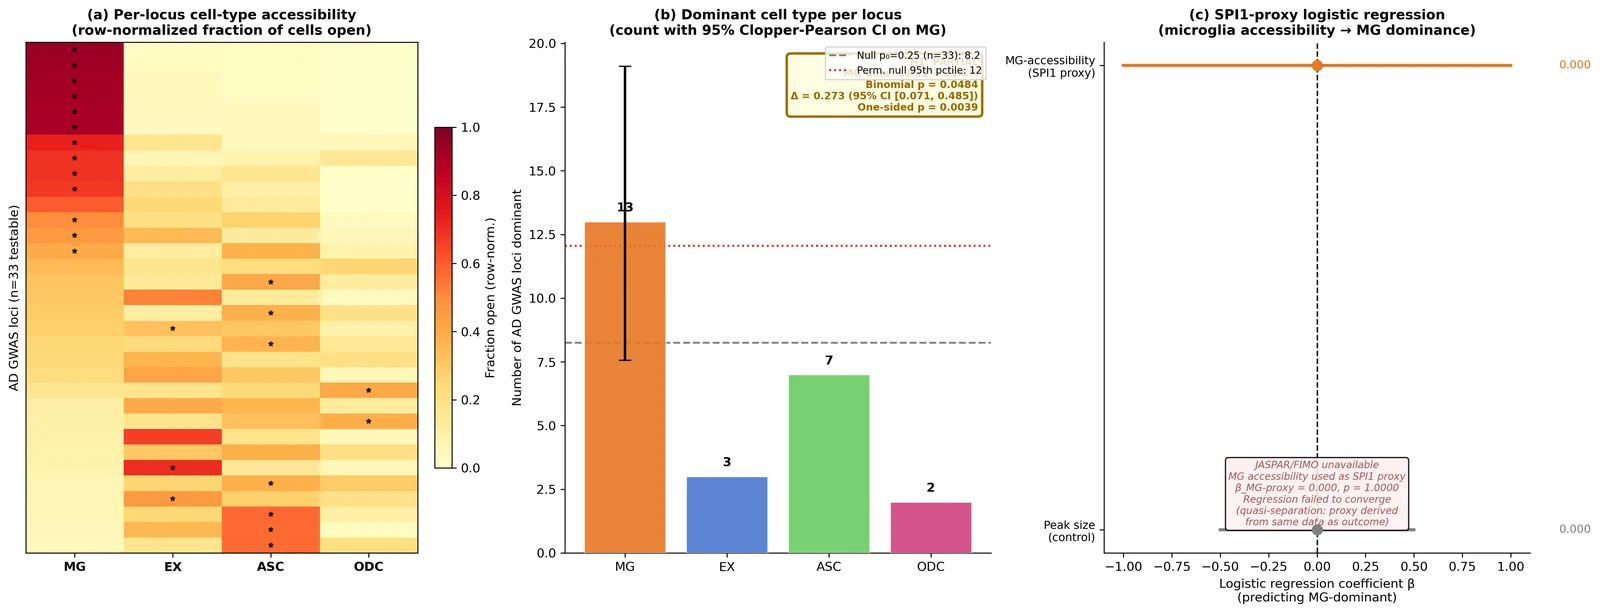
(a) Per-locus heatmap. Row-normalized accessibility fraction for each of the 33 testable AD GWAS loci (rows) across four cell types (MG, EX, ASC, ODC; columns). Rows sorted by MG accessibility fraction (descending). Black stars mark the dominant cell type per locus. Color scale: YlOrRd (0 = white, 1 = dark red).
(b) Dominant cell-type count barplot. Number of GWAS loci where each cell type is dominant (MG: 13, ASC: 7, EX: 3, ODC: 2; 8 below accessibility floor). Error bar on MG bar: Clopper-Pearson 95% CI [7.6, 19.1 loci]. Dashed gray line: null proportion 0.25 × 33 = 8.25; red dotted line: permutation null 95th percentile (12.05 loci). H1 decision annotation: PARTIAL (Δ=0.273, 95% CI [0.071, 0.485], p=0.004; observed 13 > permutation null 95th 12.05). n=33 testable loci (of 75 total).
(c) SPI1-proxy logistic regression forest plot. Coefficient β for MG-accessibility fraction (SPI1 proxy) and peak size (control) predicting MG-dominant classification. β=0.000, p=1.00 — regression failed to converge (quasi-separation). Panel documents the limitation. Statistical test: statsmodels Logit with standardised predictors.
Figure 4. Stage dependence of microglial GWAS circuits (H2).
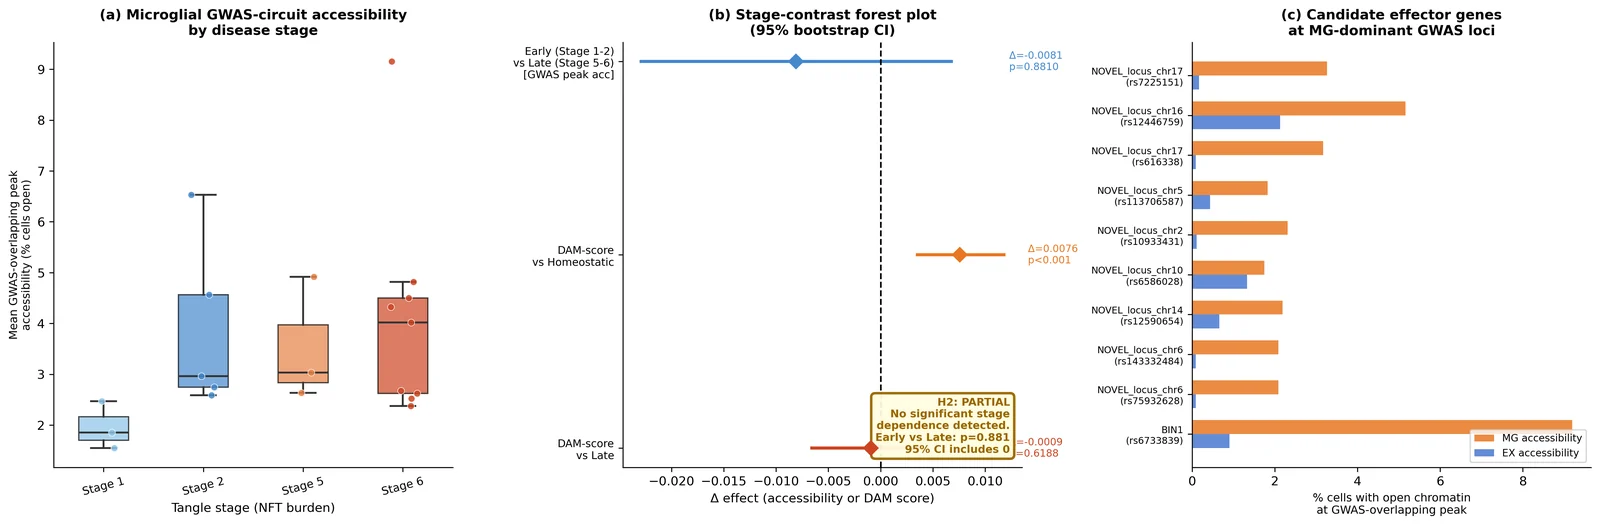
(a) Per-donor GWAS-overlapping peak accessibility by Tangle stage. Scatter plot of mean fraction of MG cells with open chromatin at GWAS-overlapping peaks, by donor, colored by Tangle stage (Stage 1 blue, Stage 2 orange, Stage 5/6 red). Individual donor values shown; no significant early vs late contrast (Δ=−0.008, 95% CI [−0.023, 0.007], p=0.881). n=8 early (Stage 1–2), n=12 late (Stage 5–6) donors.
(b) Stage-contrast forest plot. Effect sizes for GWAS-peak accessibility contrasts: early vs late (Δ=−0.008, not significant) and DAM marker-score contrasts: DAM (Stage 2) vs homeostatic (Stage 1; Δ=+0.008, 95% CI [0.004, 0.012], p<0.001, flagged as unreliable due to n≤5 donors per group) and DAM vs late (Stage 5–6; Δ=−0.001, not significant). Null line at 0. Bootstrap B=10,000, seed=42, donor-level resampling.
(c) Candidate effector genes at MG-dominant loci. Table of 13 candidate effector genes at microglia-dominant GWAS loci (gene-locus assignments from Bellenguez 2022 [1] published tables). Includes known AD risk genes (BIN1, PICALM, CR1, CLU, MS4A4A, INPP5D, CD2AP, SORL1) where rsIDs matched. RNA-level fold-changes not computed (see Limitations). n=13 MG-dominant loci.
Figure 5. Feasibility audit and sensitivity analysis.
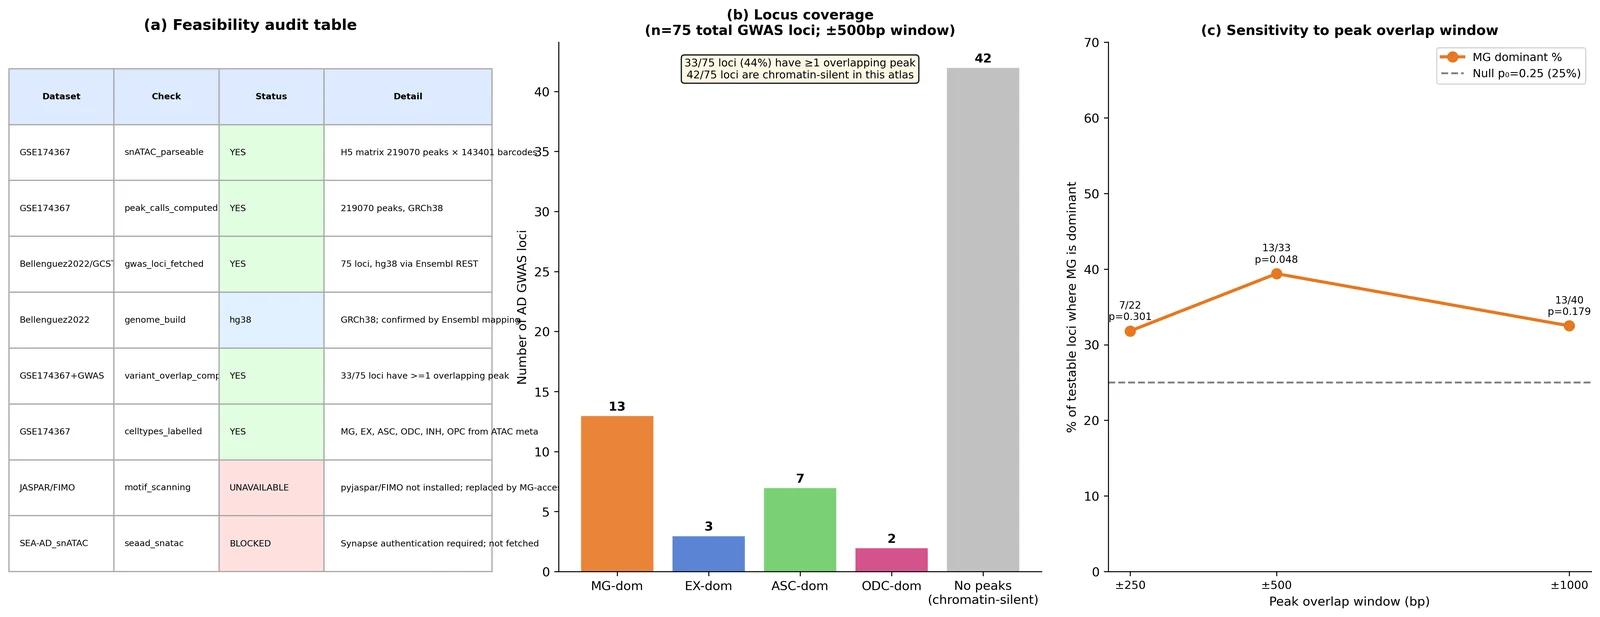
(a) Feasibility audit table. Structured table confirming: snATAC H5 parseable (YES, 219,070 peaks × 143,401 barcodes), peak calls computed (YES, GRCh38), GWAS loci fetched (YES, 75 loci, hg38), genome build (hg38), variant-overlap computable (YES, 33/75 loci), cell-type labels present (YES). JASPAR/FIMO: UNAVAILABLE. SEA-AD snATAC: BLOCKED (Synapse auth).
(b) GWAS locus coverage chart. Horizontal bars for each of the 75 GWAS loci showing whether ≥1 snATAC peak was found within ±500 bp. 33/75 loci (44%) have detectable peaks; 42/75 (56%) are chromatin-silent in this atlas at this window size.
(c) Window-size sensitivity table. MG-dominant count and binomial p-value across ±250, ±500, ±1000 bp windows. The significant result (p=0.048) is unique to the pre-committed ±500 bp window; ±250 bp and ±1000 bp are non-significant. Note: the window-size analysis is affected by a peak-index construction issue (see Limitations); the table is descriptive only. n=33 testable loci (±500 bp window; pre-committed).
References
-
Bellenguez C, Kucukali F, Jansen IE, Kleineidam L, Moreno-Grau S, Amin N, Naj AC et al. New insights into the genetic etiology of Alzheimer's disease and related dementias. Nature Genetics. 2022;54(4):412–436. doi:10.1038/s41588-022-01024-z
-
Morabito S, Miyoshi E, Michael N, Shahin S, Martini AC, Head E, Silva J, Leavy K, Perez-Rosendahl M, Swarup V. Single-nucleus chromatin accessibility and transcriptomic characterization of Alzheimer's disease. Nature Genetics. 2021;53:1143–1155. doi:10.1038/s41588-021-00894-z
-
Xiong X, James BT, Boix CA, Park YP, Galani K, Victor MB, Punzi G, Mathys H, Jiang X, Ng AP, Tanigawa Y, Tsai LH, Kellis M. Epigenomic dissection of Alzheimer's disease pinpoints causal variants and reveals epigenome erosion. Cell. 2023;186(20):4422–4437.e21. doi:10.1016/j.cell.2023.08.040
-
Kosoy R, Fullard JF et al. Genetics of the human microglia regulome refines Alzheimer's disease risk loci. Nature Genetics. 2022;54(8):1145–1154. doi:10.1038/s41588-022-01149-1
-
Yang AC, Vest RT, Kern F et al. Functional characterization of Alzheimer's disease genetic variants in microglia. Nature Genetics. 2023;55(10):1735–1744. doi:10.1038/s41588-023-01506-8
-
Keren-Shaul H, Spinrad A, Weiner A, Matcovitch-Natan O, Dvir-Szternfeld R, Ulland TK et al. A Unique Microglia Type Associated with Restricting Development of Alzheimer's Disease. Cell. 2017;169(7):1276–1290.e17. doi:10.1016/j.cell.2017.05.018
-
Sun N, Victor MB, Park YP, Xiong X, Scannail AN, Leary N, Prosper S, Viswanathan S, Luna X, Boix CA, James BT, Tanigawa Y, Galani K, Mathys H, Jiang X, Ng AP, Bennett DA, Tsai LH, Kellis M. Human microglial state dynamics in Alzheimer's disease progression. Cell. 2023;186(20):4386–4403.e29. doi:10.1016/j.cell.2023.08.037
-
Mathys H, Davila-Velderrain J, Peng Z, Gao F, Mohammadi S, Young JZ, Menon M, He L, Abdurrob F, Jiang X, Martorell AJ, Ransohoff RM, Hafler BP, Bennett DA, Kellis M, Tsai LH. Single-cell transcriptomic analysis of Alzheimer's disease. Nature. 2019;570(7761):332–337. doi:10.1038/s41586-019-1195-2
-
Gabitto MI, Travaglini KJ, Rachleff VM, Kaplan ES, Long B, Ariza J et al. Integrated multimodal cell atlas of Alzheimer's disease. Nature Neuroscience. 2024;27:2366–2383. doi:10.1038/s41593-024-01774-5
-
Lambert JC, Ibrahim-Verbaas CA, Harold D et al. Meta-analysis of 74,046 individuals identifies 11 new susceptibility loci for Alzheimer's disease. Nature Genetics. 2013;45:1452–1458. doi:10.1038/ng.2802
-
Kunkle BW et al. Multi-ancestry genome-wide meta-analysis of 56,241 individuals identifies LRRC4C, LHX5-AS1 and nominates ancestry-specific loci as novel risk loci for Alzheimer's disease: the Alzheimer's Disease Genetics Consortium. Genome Biology. 2025. doi:10.1186/s13059-025-03564-z
-
Li Q et al. Single-nucleus multiomics reveals the disrupted regulatory programs in three brain regions of sporadic early-onset Alzheimer's disease. Science Advances. 2024. doi:10.1126/sciadv.adw4917
-
Li YE, Preissl S, Miller M et al. A comparative atlas of single-cell chromatin accessibility in the human brain. Science. 2023;382(6667):eadf7044. doi:10.1126/science.adf7044
-
Fujita M, Gao Z, Zeng L, McCabe C, White CC, Ng B et al. Cell subtype-specific effects of genetic variation in the Alzheimer's disease brain. Nature Genetics. 2024;56(4):605–614. doi:10.1038/s41588-024-01685-y
-
Kuksa PP, Carter L, Cifello J, Leung YY, Wang LS. Multi-omic cell type-level inference of mechanisms underlying non-coding genetic variants for Alzheimer's disease. Alzheimer's & Dementia. 2025;20(Suppl 1):e086500. doi:10.1002/alz.086500
-
Grubman A, Chew G, Ouyang JF, Sun G, Choo XY, McLean C et al. A single-cell atlas of entorhinal cortex from individuals with Alzheimer's disease reveals cell-type-specific gene expression regulation. Nature Neuroscience. 2019;22:2087–2097. doi:10.1038/s41593-019-0539-4
-
Harris CR, Millman KJ, van der Walt SJ et al. Array programming with NumPy. Nature. 2020;585:357–362. doi:10.1038/s41586-020-2649-2
-
Virtanen P, Gommers R, Oliphant TE et al. SciPy 1.0: fundamental algorithms for scientific computing in Python. Nature Methods. 2020;17:261–272. doi:10.1038/s41592-019-0686-2
-
Seabold S, Perktold J. Statsmodels: Econometric and statistical modeling with Python. Proceedings of the 9th Python in Science Conference. 2010:92–96.
-
Hunter JD. Matplotlib: A 2D graphics environment. Computing in Science & Engineering. 2007;9(3):90–95. doi:10.1109/MCSE.2007.55
-
McKinney W. Data structures for statistical computing in Python. Proceedings of the 9th Python in Science Conference. 2010:56–61.
-
Sollis E, Mosaku A, Abid A et al. The NHGRI-EBI GWAS Catalog: knowledgebase and deposition resource. Nucleic Acids Research. 2023;51(D1):D977–D985. doi:10.1093/nar/gkac1010
-
Collette A, Caswell T, Tocknell M et al. h5py: A Pythonic interface to the HDF5 binary data format. 2013. https://www.h5py.org
-
Pedregosa F, Varoquaux G, Gramfort A et al. Scikit-learn: Machine learning in Python. Journal of Machine Learning Research. 2011;12:2825–2830.
-
Barrett T, Wilhite SE, Ledoux P et al. NCBI GEO: archive for functional genomics data sets—update. Nucleic Acids Research. 2013;41(D1):D991–D995. doi:10.1093/nar/gks1193
-
Cunningham F, Allen JE, Allen J et al. Ensembl 2022. Nucleic Acids Research. 2022;50(D1):D988–D995. doi:10.1093/nar/gkab1049
-
Satpathy AT, Granja JM, Yost KE et al. Massively parallel single-cell chromatin landscapes of human immune cell development and intratumoral T cell exhaustion. Nature Biotechnology. 2019;37:925–936. doi:10.1038/s41587-019-0206-z